
|
VULCAN-CFD
Application Portfolio |
|
|
|
VULCAN-CFD
Application Portfolio |
|

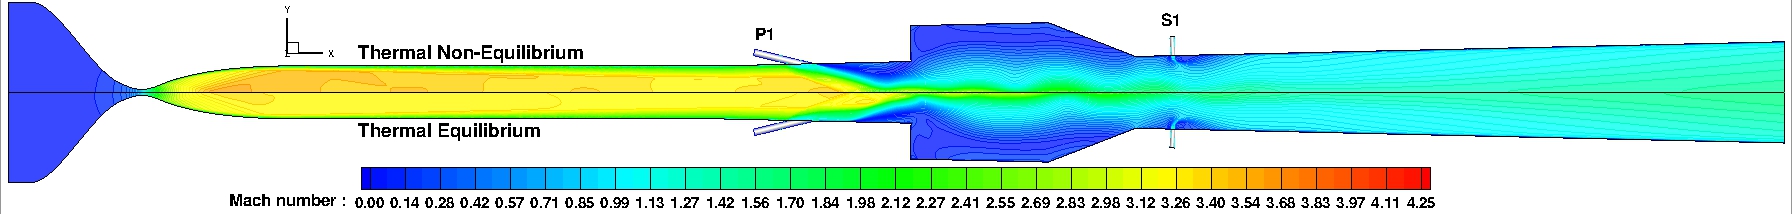
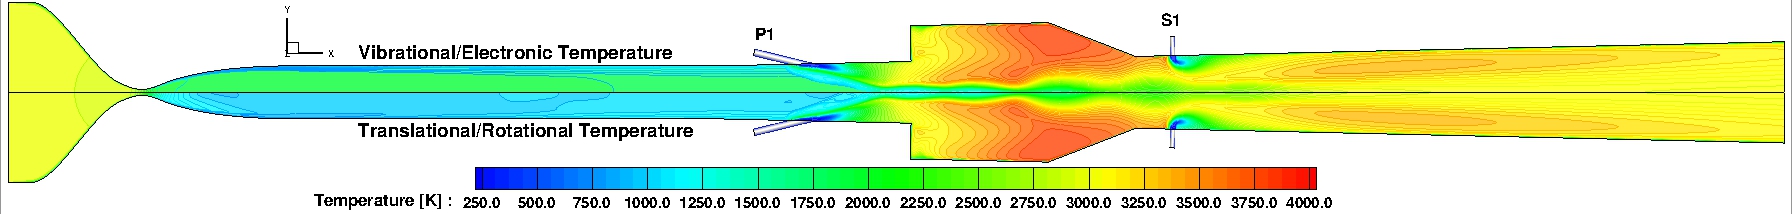
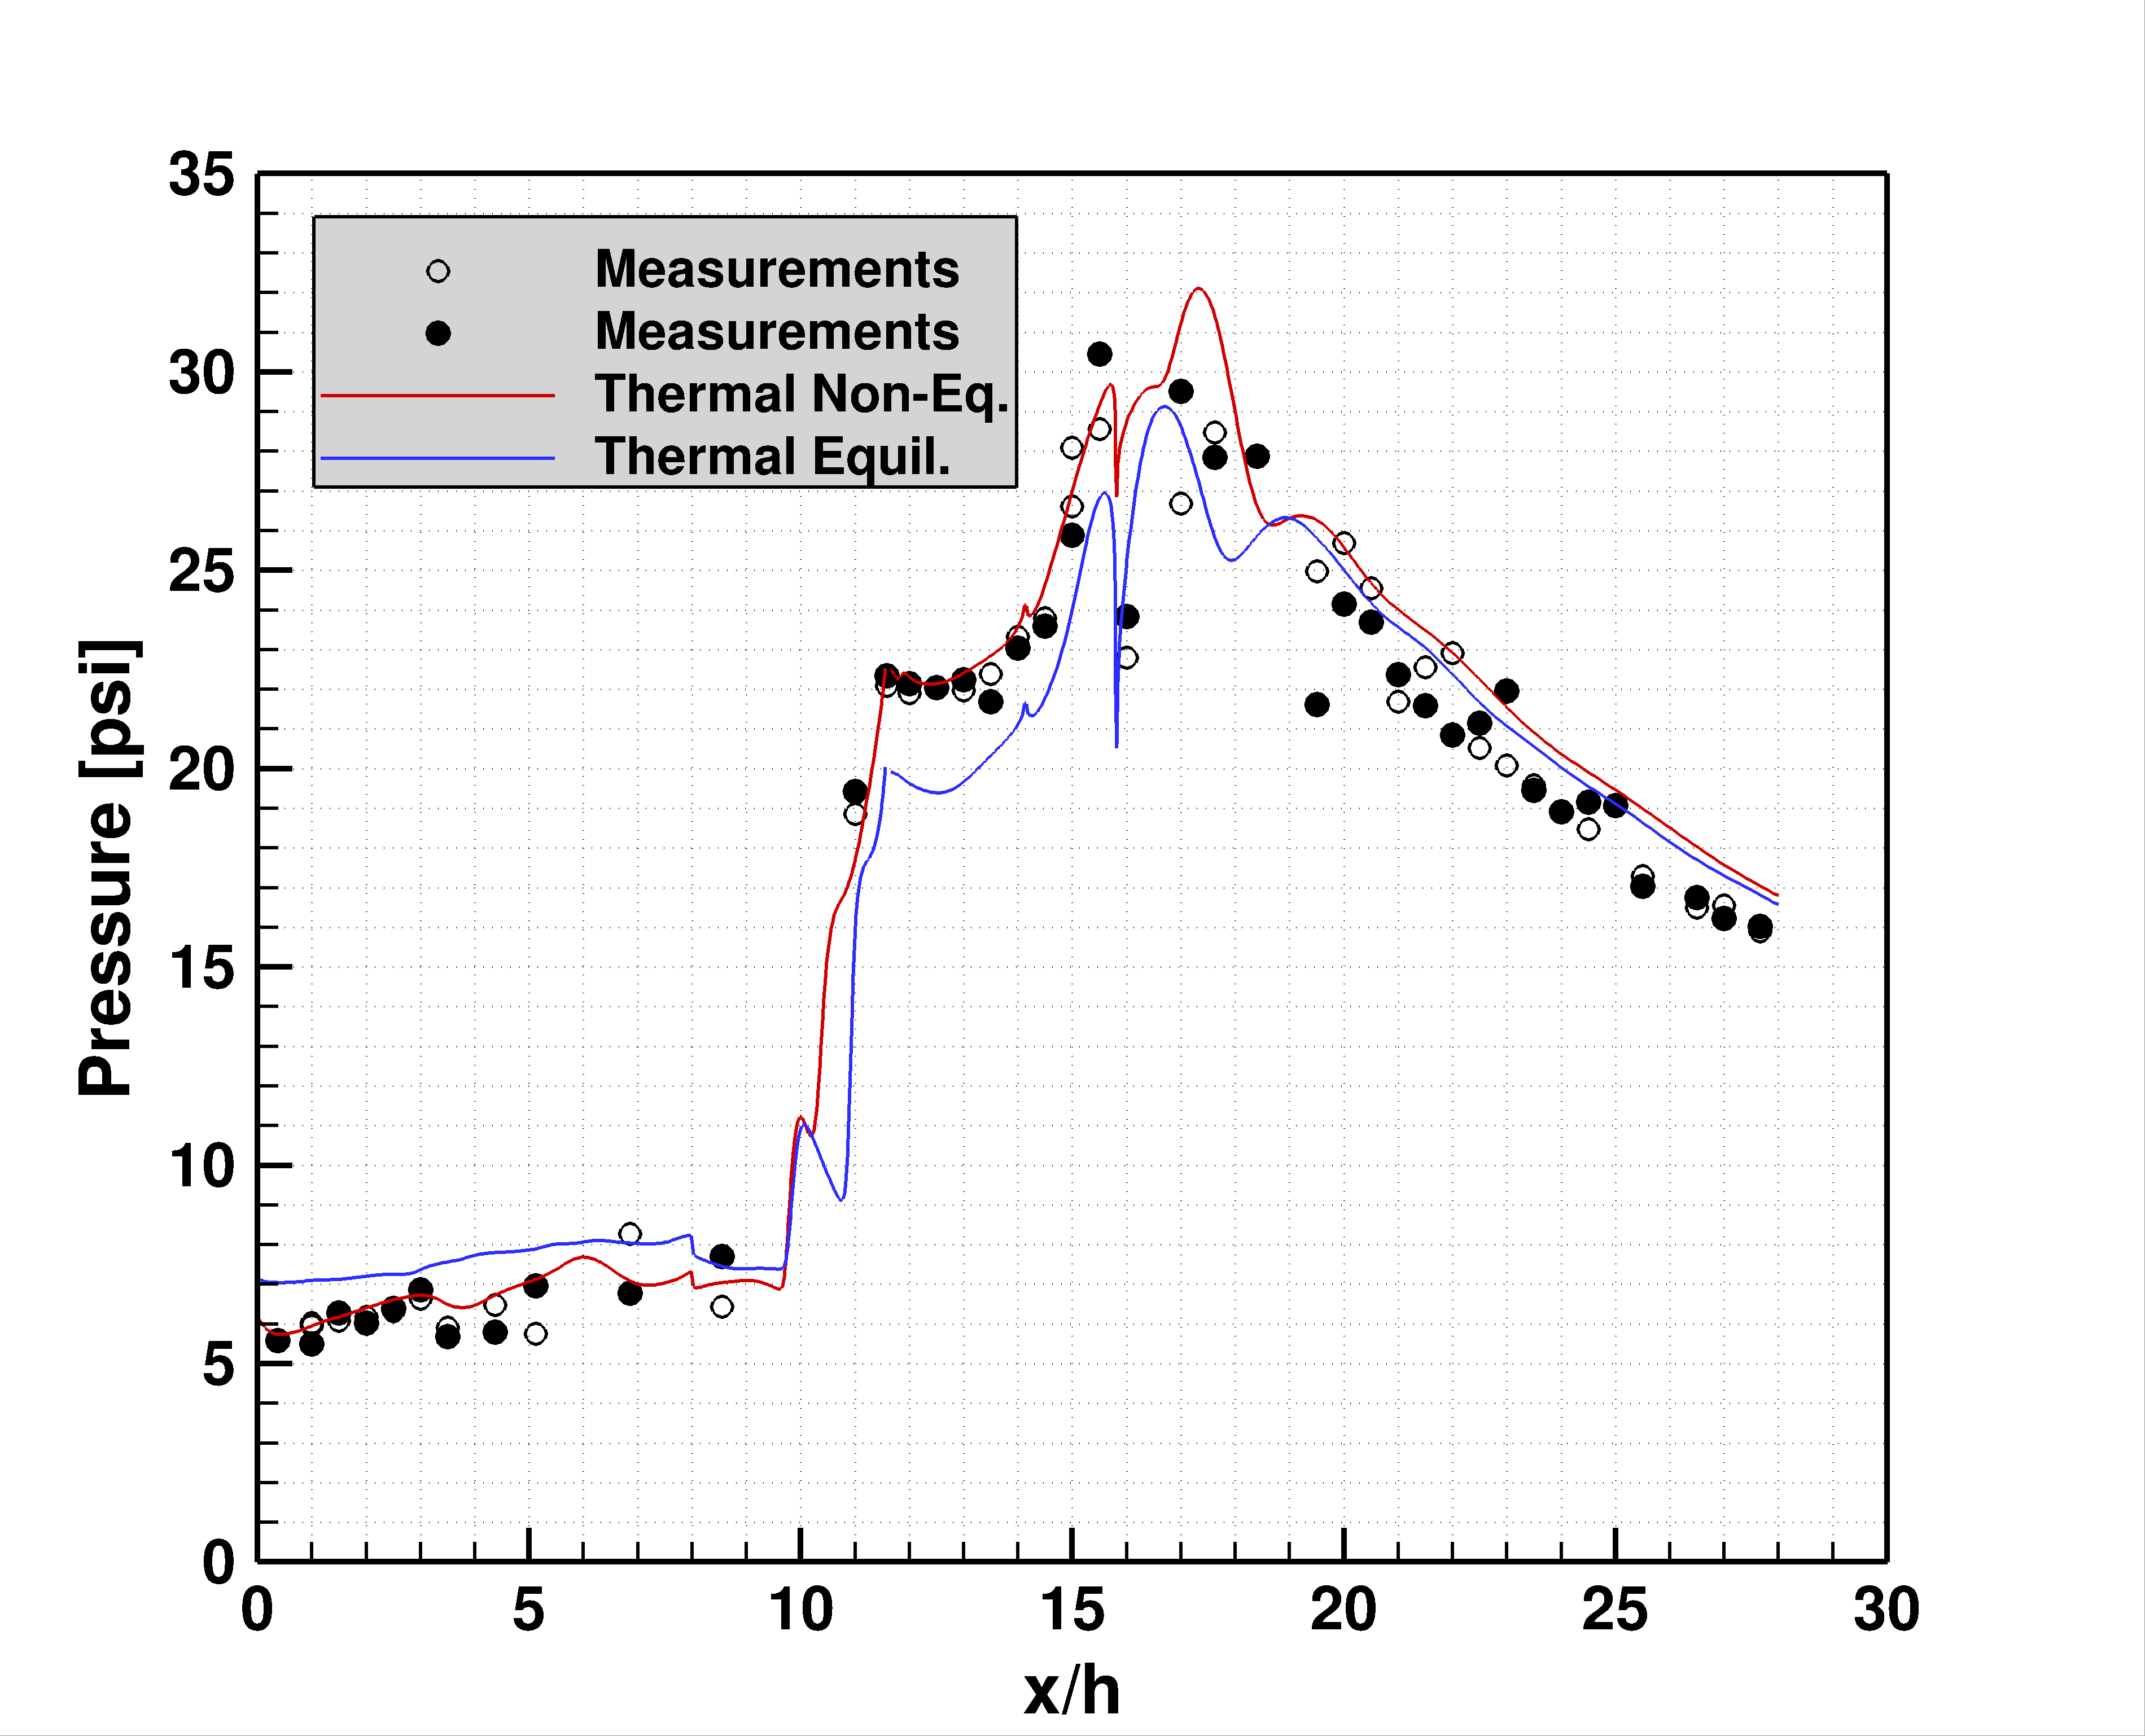
Reynolds-Averaged Simulations of the HIFiRE Flight 2 Vehicle
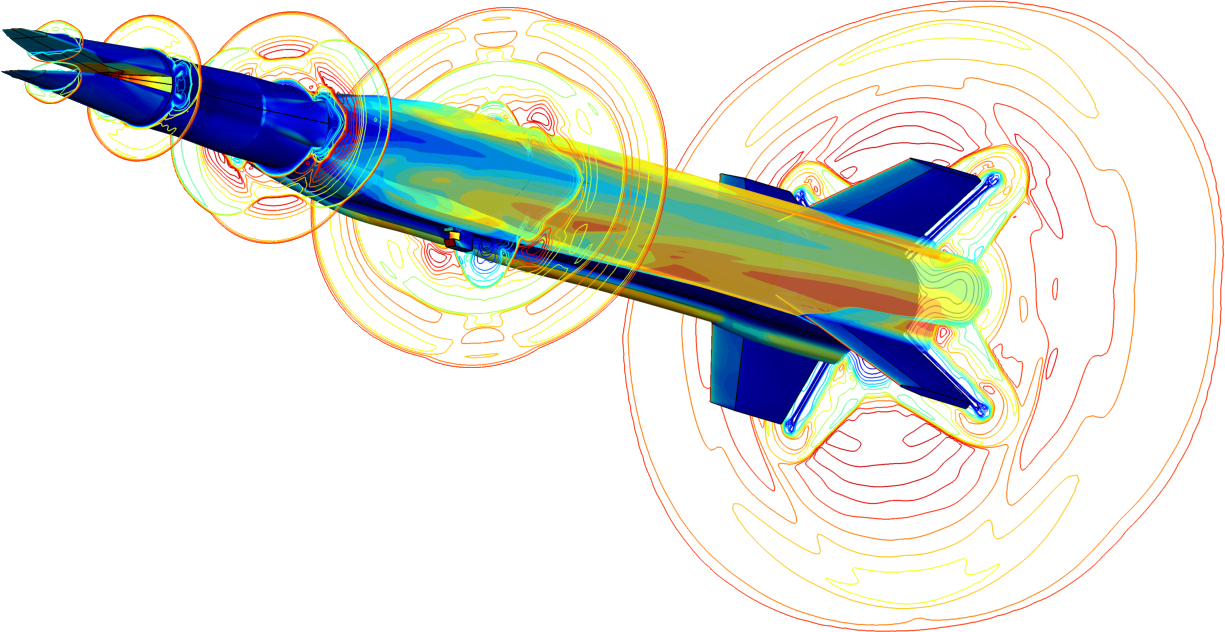
The above image displays Mach number and surface pressure contours from a tare simulation of the HIFiRE flight 2 vehicle at Mach 6.25. Images of the combusting flowfield within the scramjet engine taken from simulations of direct-connect tests performed at Mach 8 flight conditions in the NASA Langley Scramjet Test Facility are provided in the links below. Further details on the effects of thermodynamic non-equilibrium for this application can be found in [Baurle, 2014].
Engine Mach number contours with and without accounting for facility thermal non-equilibrium effects
Engine vibrational/electronic and translational/rotational temperature contours showing regions of thermal non-equilibrium
Comparison of surface pressure through the engine with measurements showing the influence of thermal non-equilibrium effects introduced by the arc-heated facility
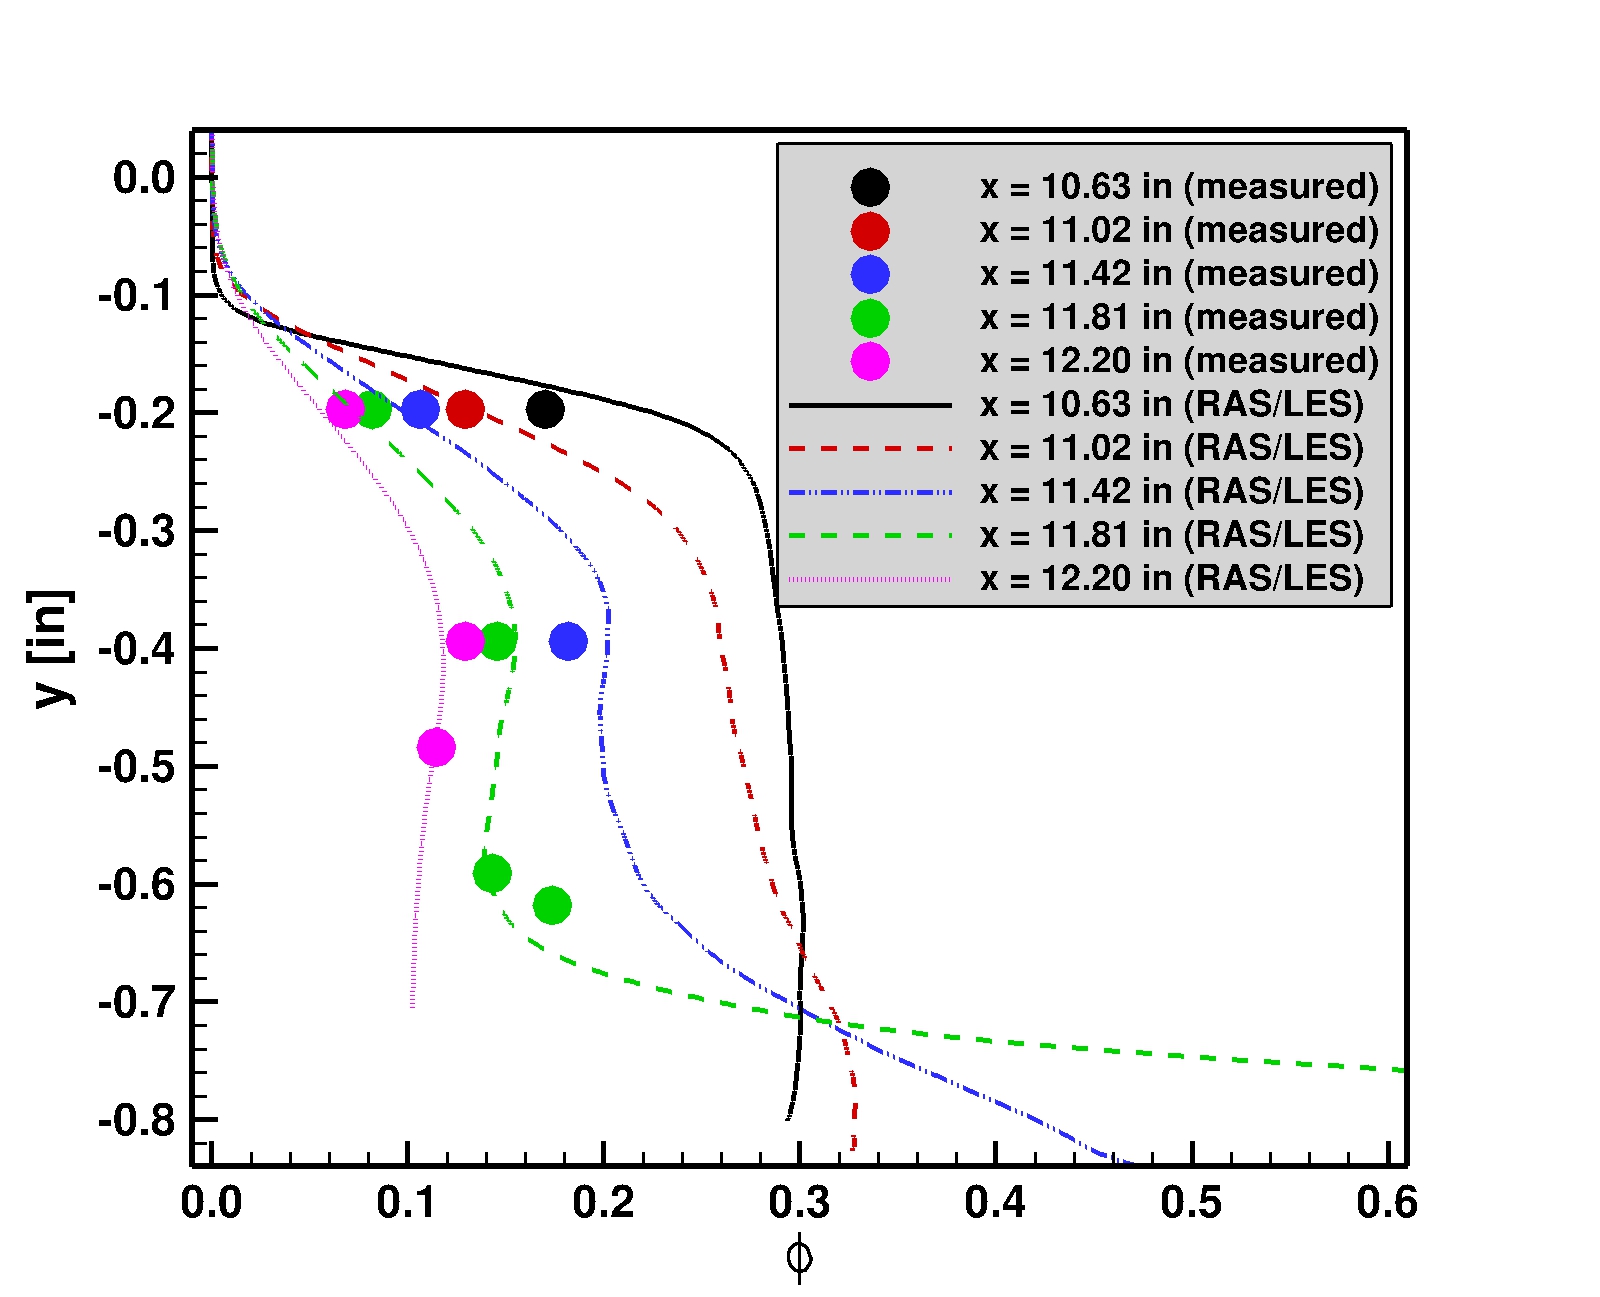
Hybrid Reynolds-Averaged/Large Eddy Simulations of a Scramjet Flameholder
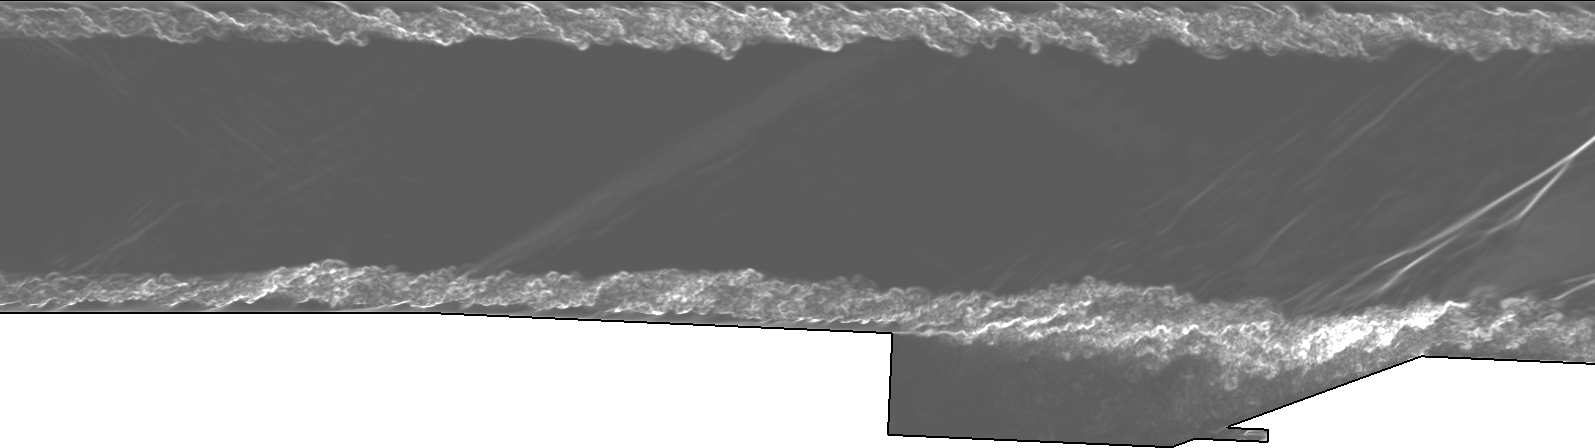
The above image is an instantaneous snapshot of the density gradient magnitude (intended to emulate a schlieren image) taken from a hybrid RAS/LES of a scramjet flameholder with Mach 2 combustor entrance conditions. The simulation was performed using the low dissipation numerical algorithms available in VULCAN-CFD for scale-resolving simulations. Time-averaged equivalence ratio profiles within the cavity at several streamwise stations are compared with measurements taken from Research Cell 19 tests at Wright-Patterson AFB are shown here. Further details on this application can be found in [Baurle, 2016].
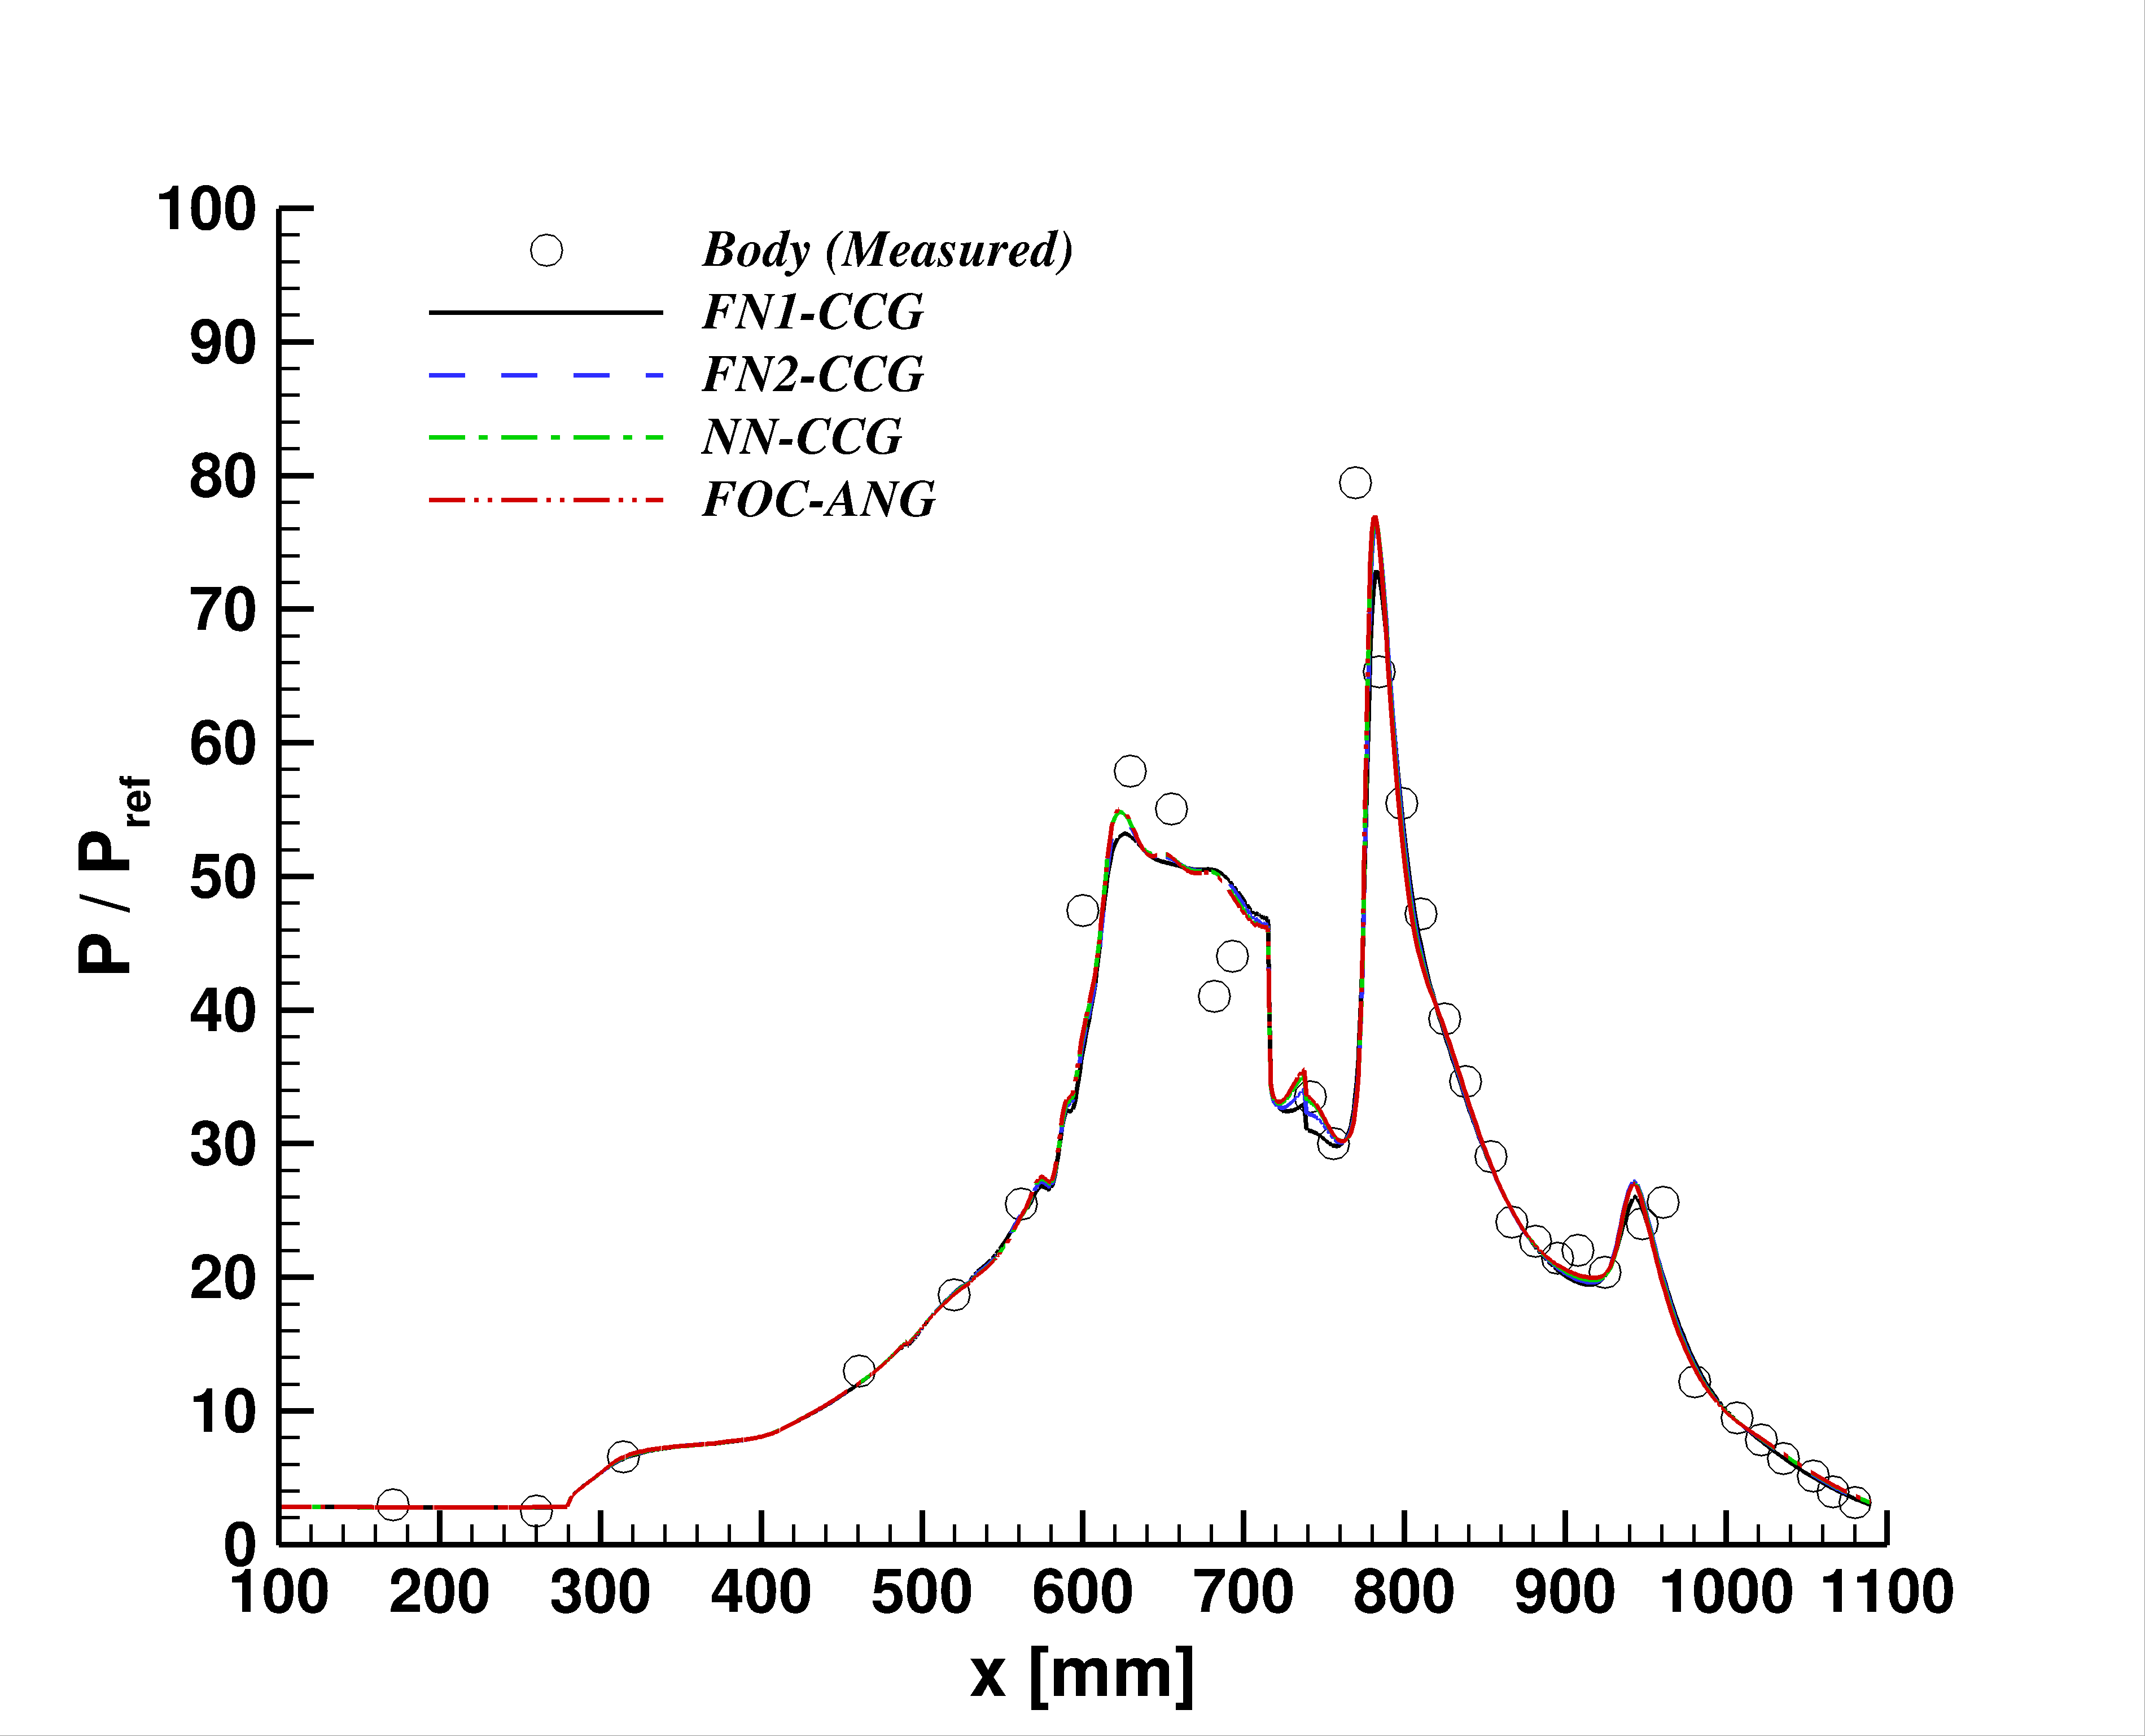
Reynolds-Averaged Simulations of the Rectangular-to-Elliptic Shape Transition (REST) Inlet for the HIFiRE Flight 7 Vehicle
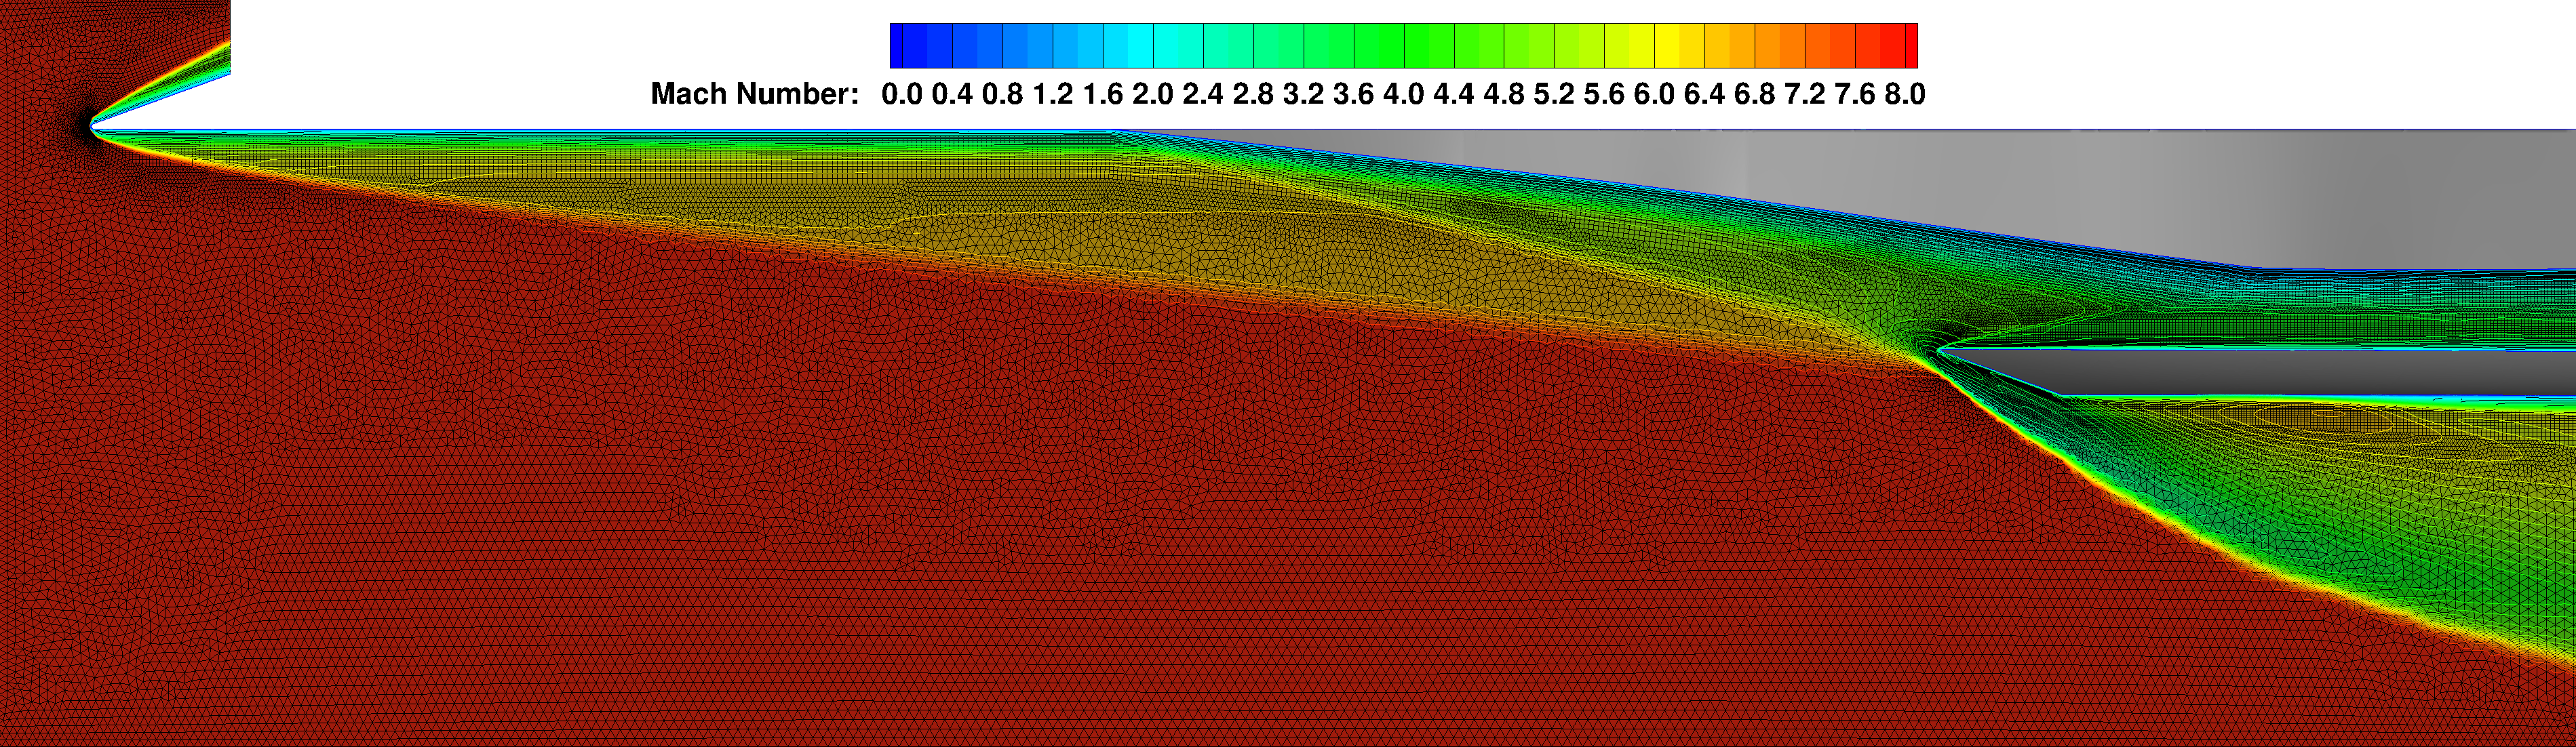
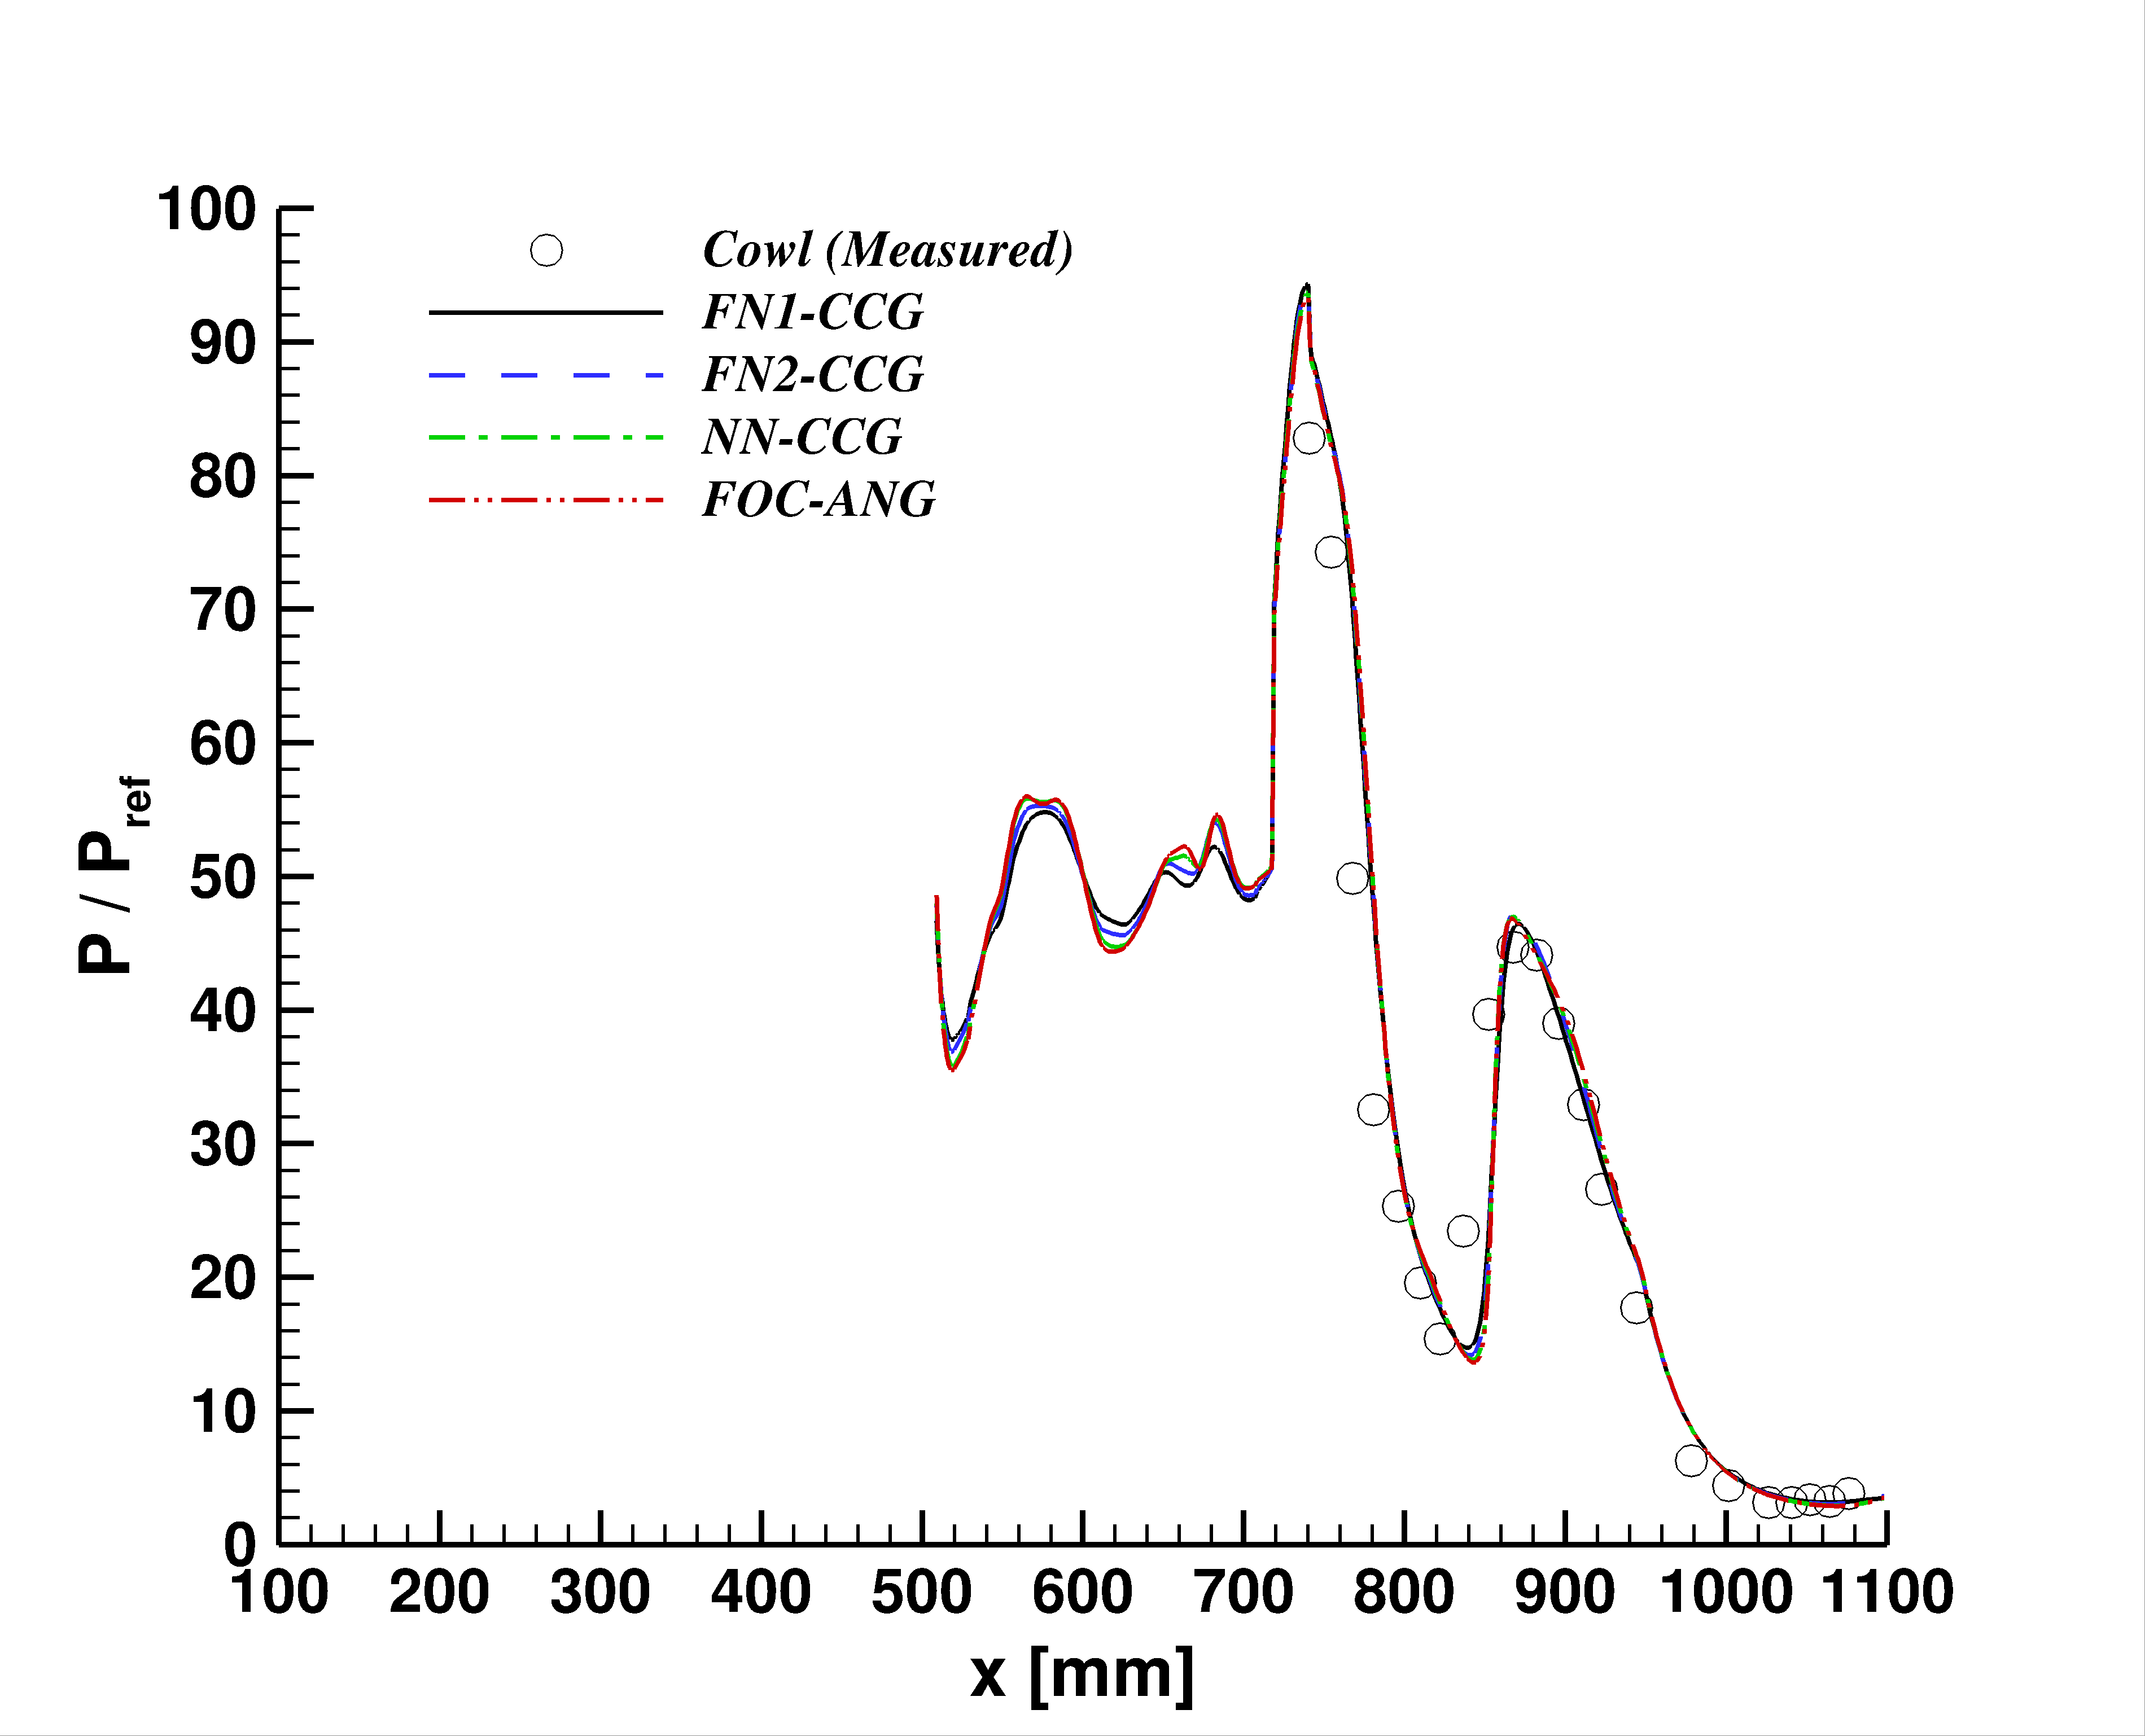
The above image displays Mach number contours overlaid on the mixed element unstructured grid used to perform simulations of the HIFiRE flight 7 REST inlet tested at Mach 8 flight conditions in the University of Queensland T4 Stalker Tube. A comparison of surface pressure with measurements along the body and cowl surfaces using several of the unstructured gradient calculation options available in VULCAN-CFD are provided in the links below. Further details on this application can be found in [White et al., 2020].
Body-side wall pressure comparisons with measurements
Cowl-side wall pressure comparisons with measurements
The labels used to denote the gradient construction method in these images are defined as follows:
FN1-CCG : least-squares cell-centered gradient stencil constructed from cells that share a face with the host cell
FN2-CCG : an extended version of the FN1-CCG stencil that includes all cells that share faces with the FN1-CCG stencil cells
NN-CCG : least-squares cell-centered gradient stencil constructed from all cells that share a node with the host cell
FOC-ANG : least-squares node-centered gradient that is averaged to produce face-centered or cell-centered gradients
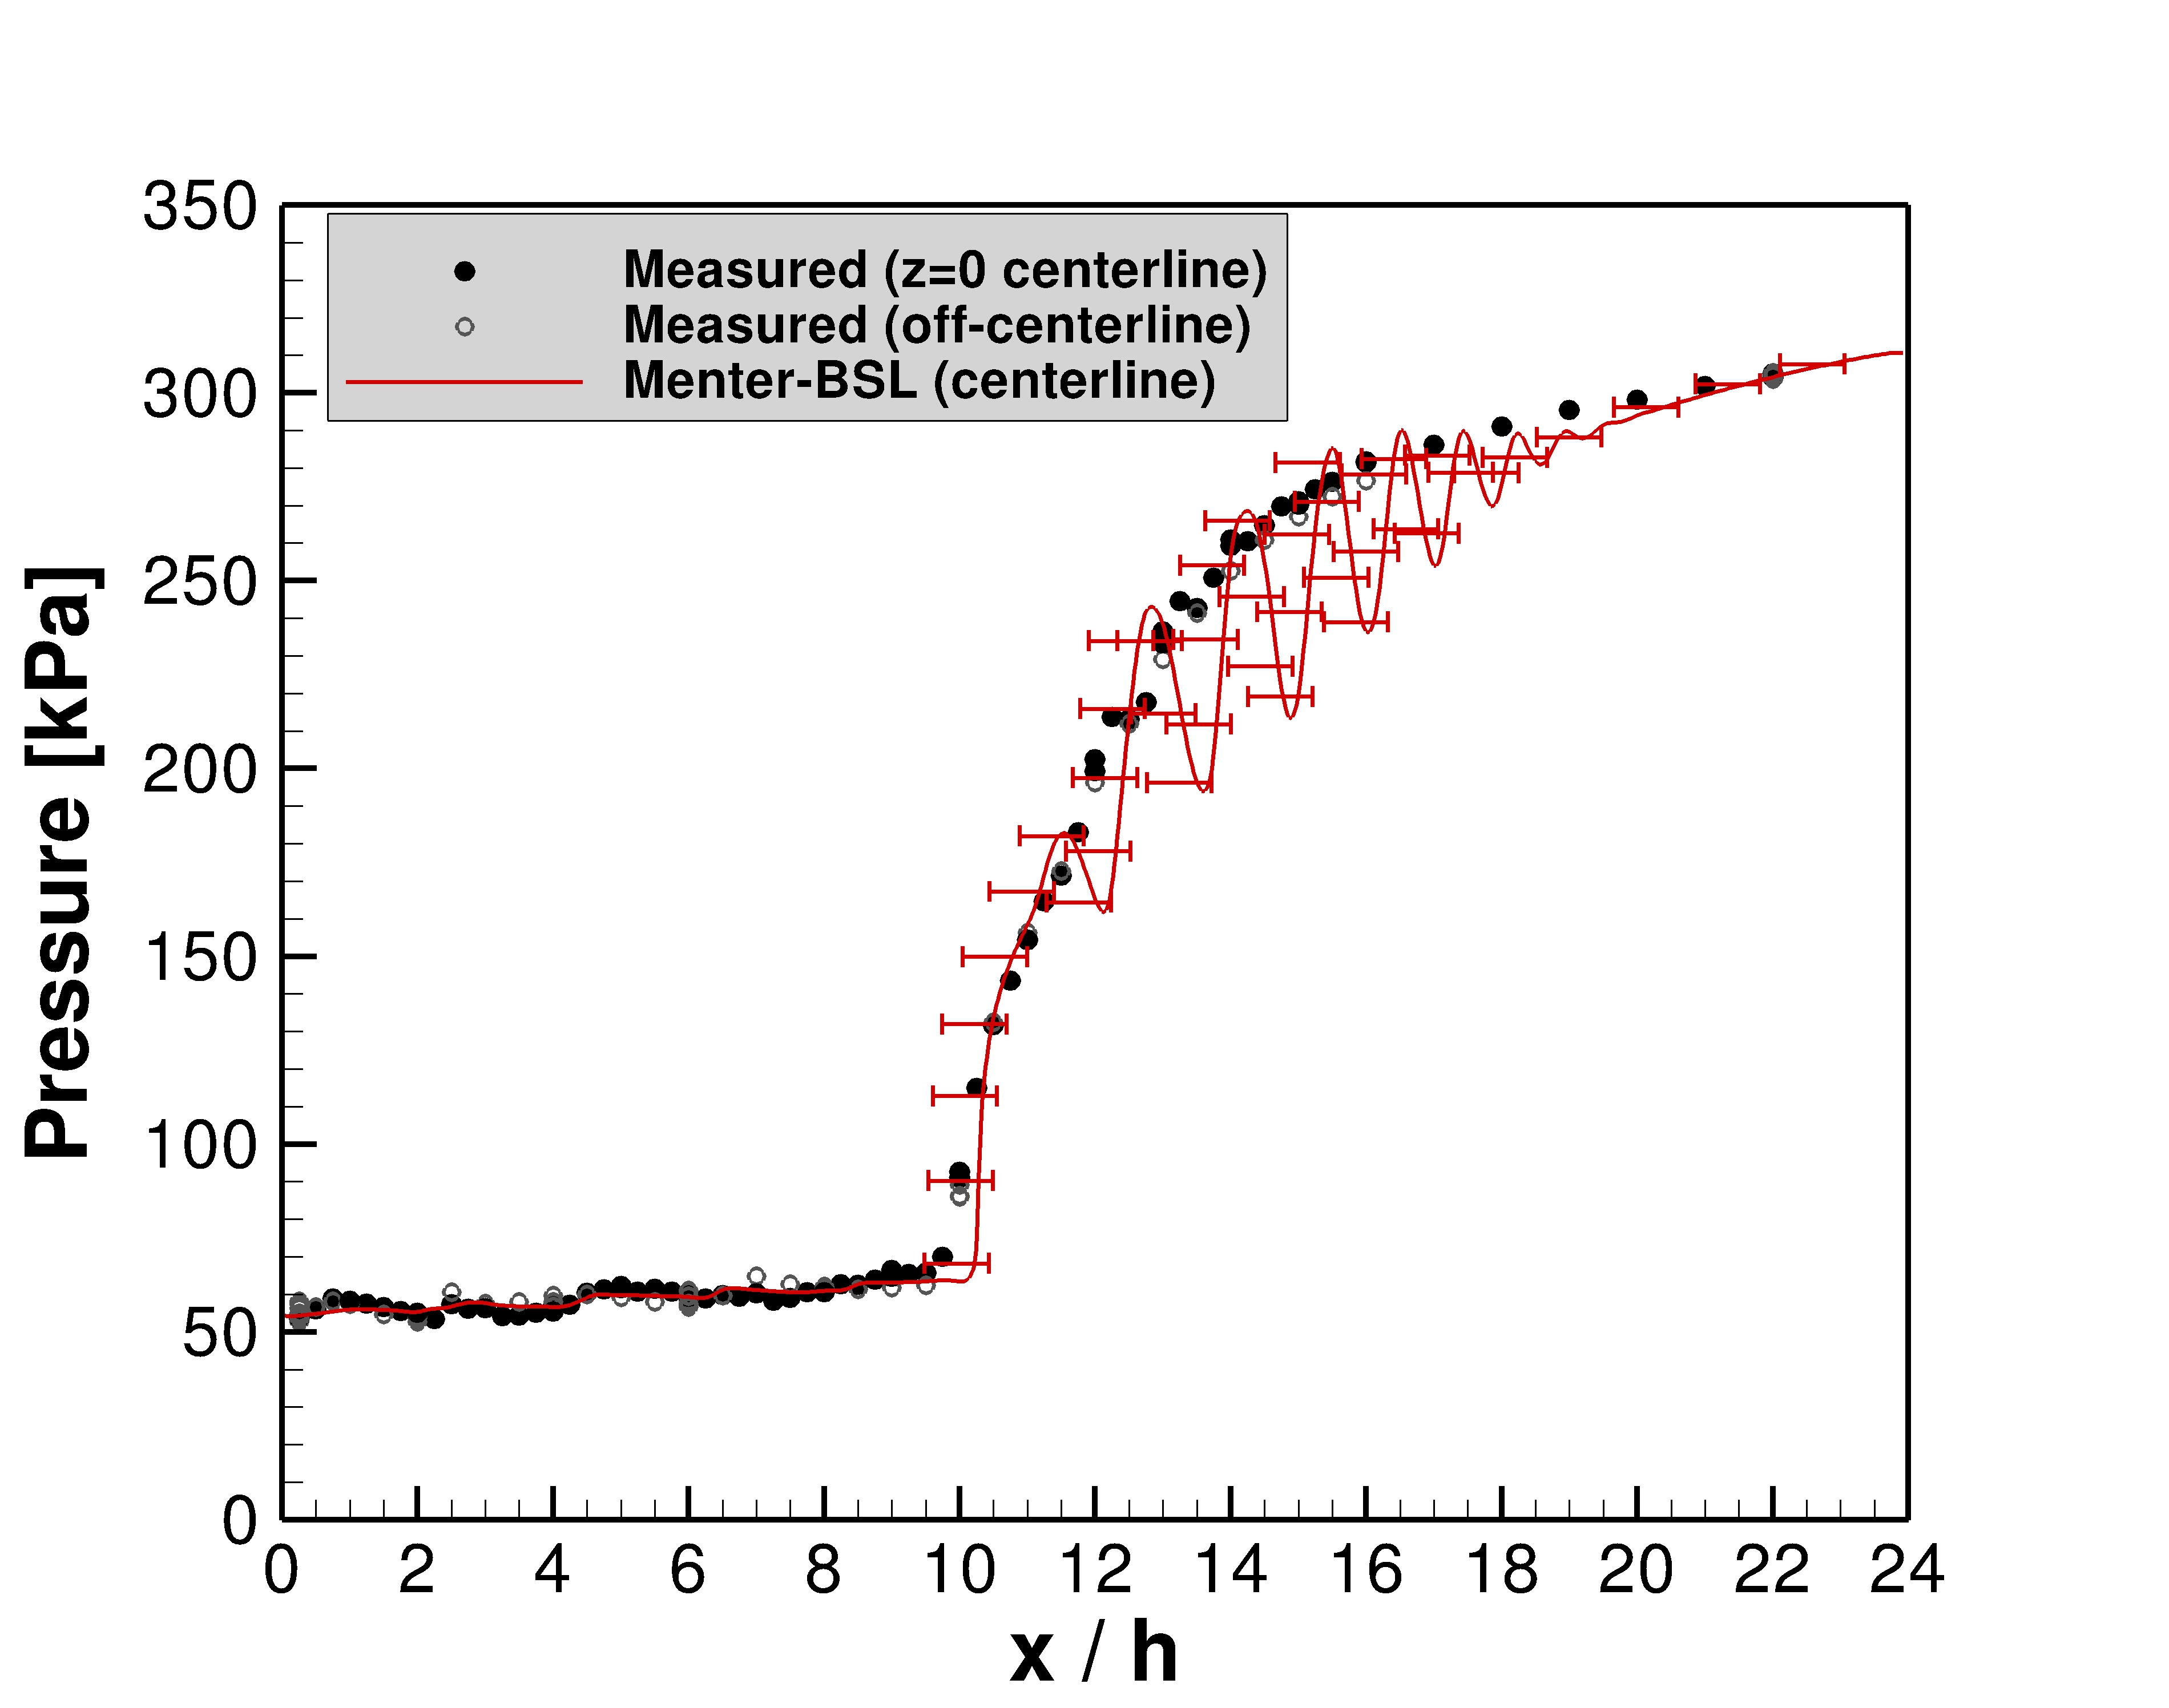
Simulations of Scramjet Isolator Flow Physics
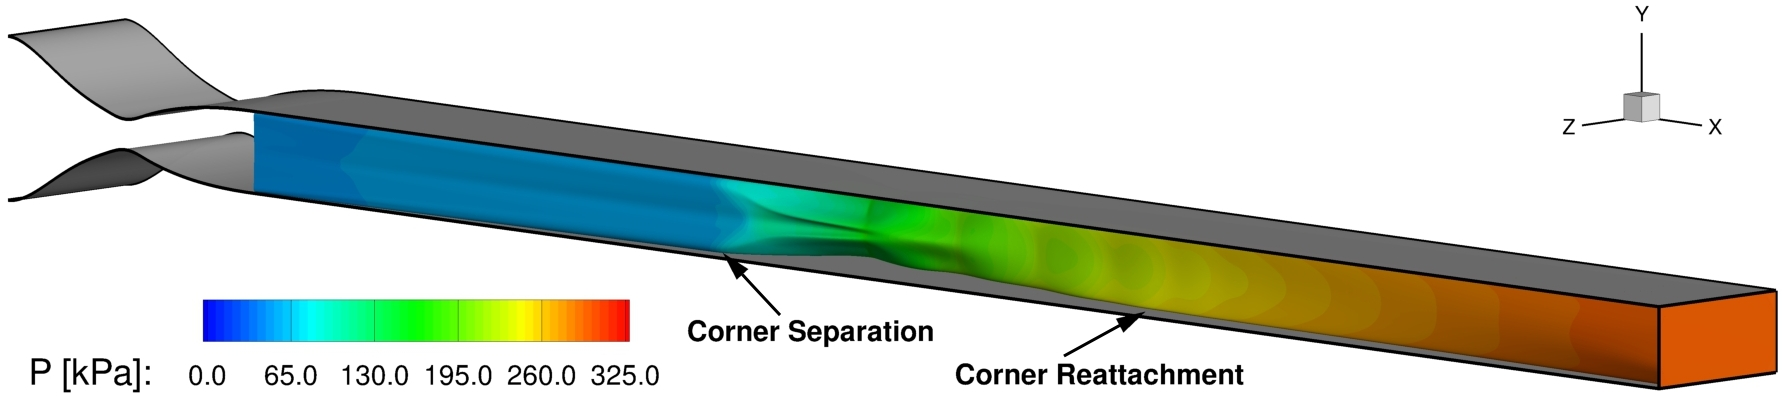
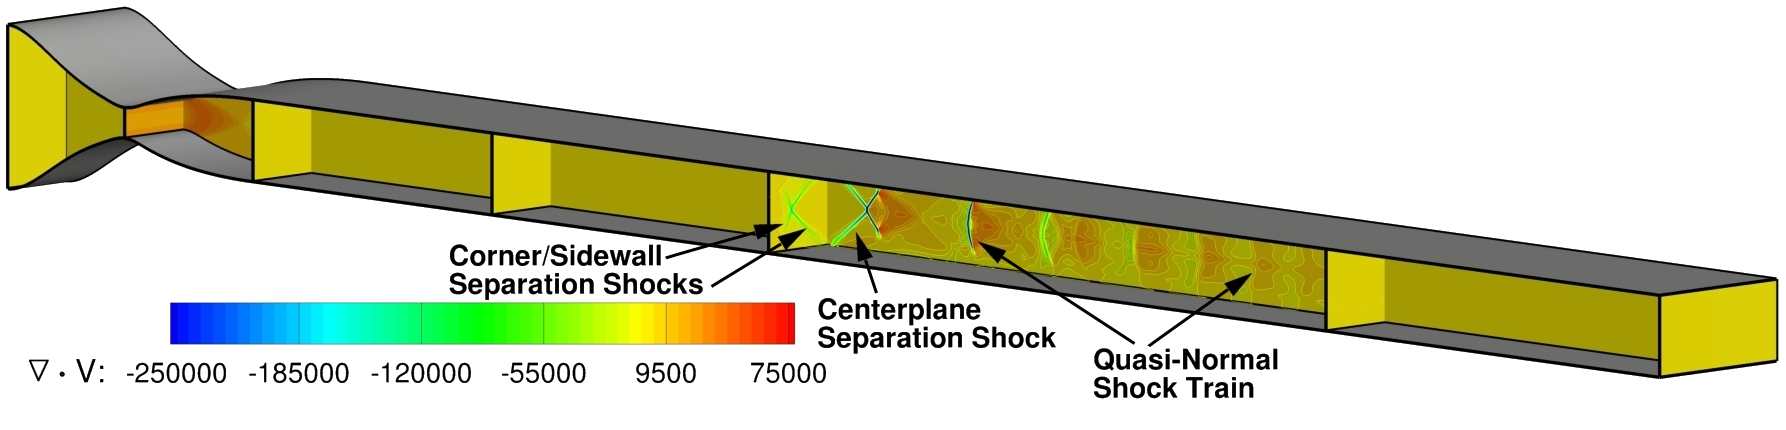
The images above display several fluid dynamic features that characterize isolator shock train flow physics. The top image is an iso-surface of total pressure (Po = 300.0 kPa) colored by static pressure values. This image provides a visual of the core flow displacement caused by boundary layer growth and flow separation due to shock / boundary layer interactions. The bottom image shows a fence plot of velocity divergence contours that visualize the details of the isolator shock train structure. A comparison of surface pressure with measurements performed as part of a validation exercise for the Menter-BSL turbulence model is shown here, with error bars depicting the results of an effort to quantify uncertainties. Further details on the uncertainty quantification approach for this application can be found in [Baurle, 2017].
Simulations of Scramjet Fuel/Air Mixing Flow Physics
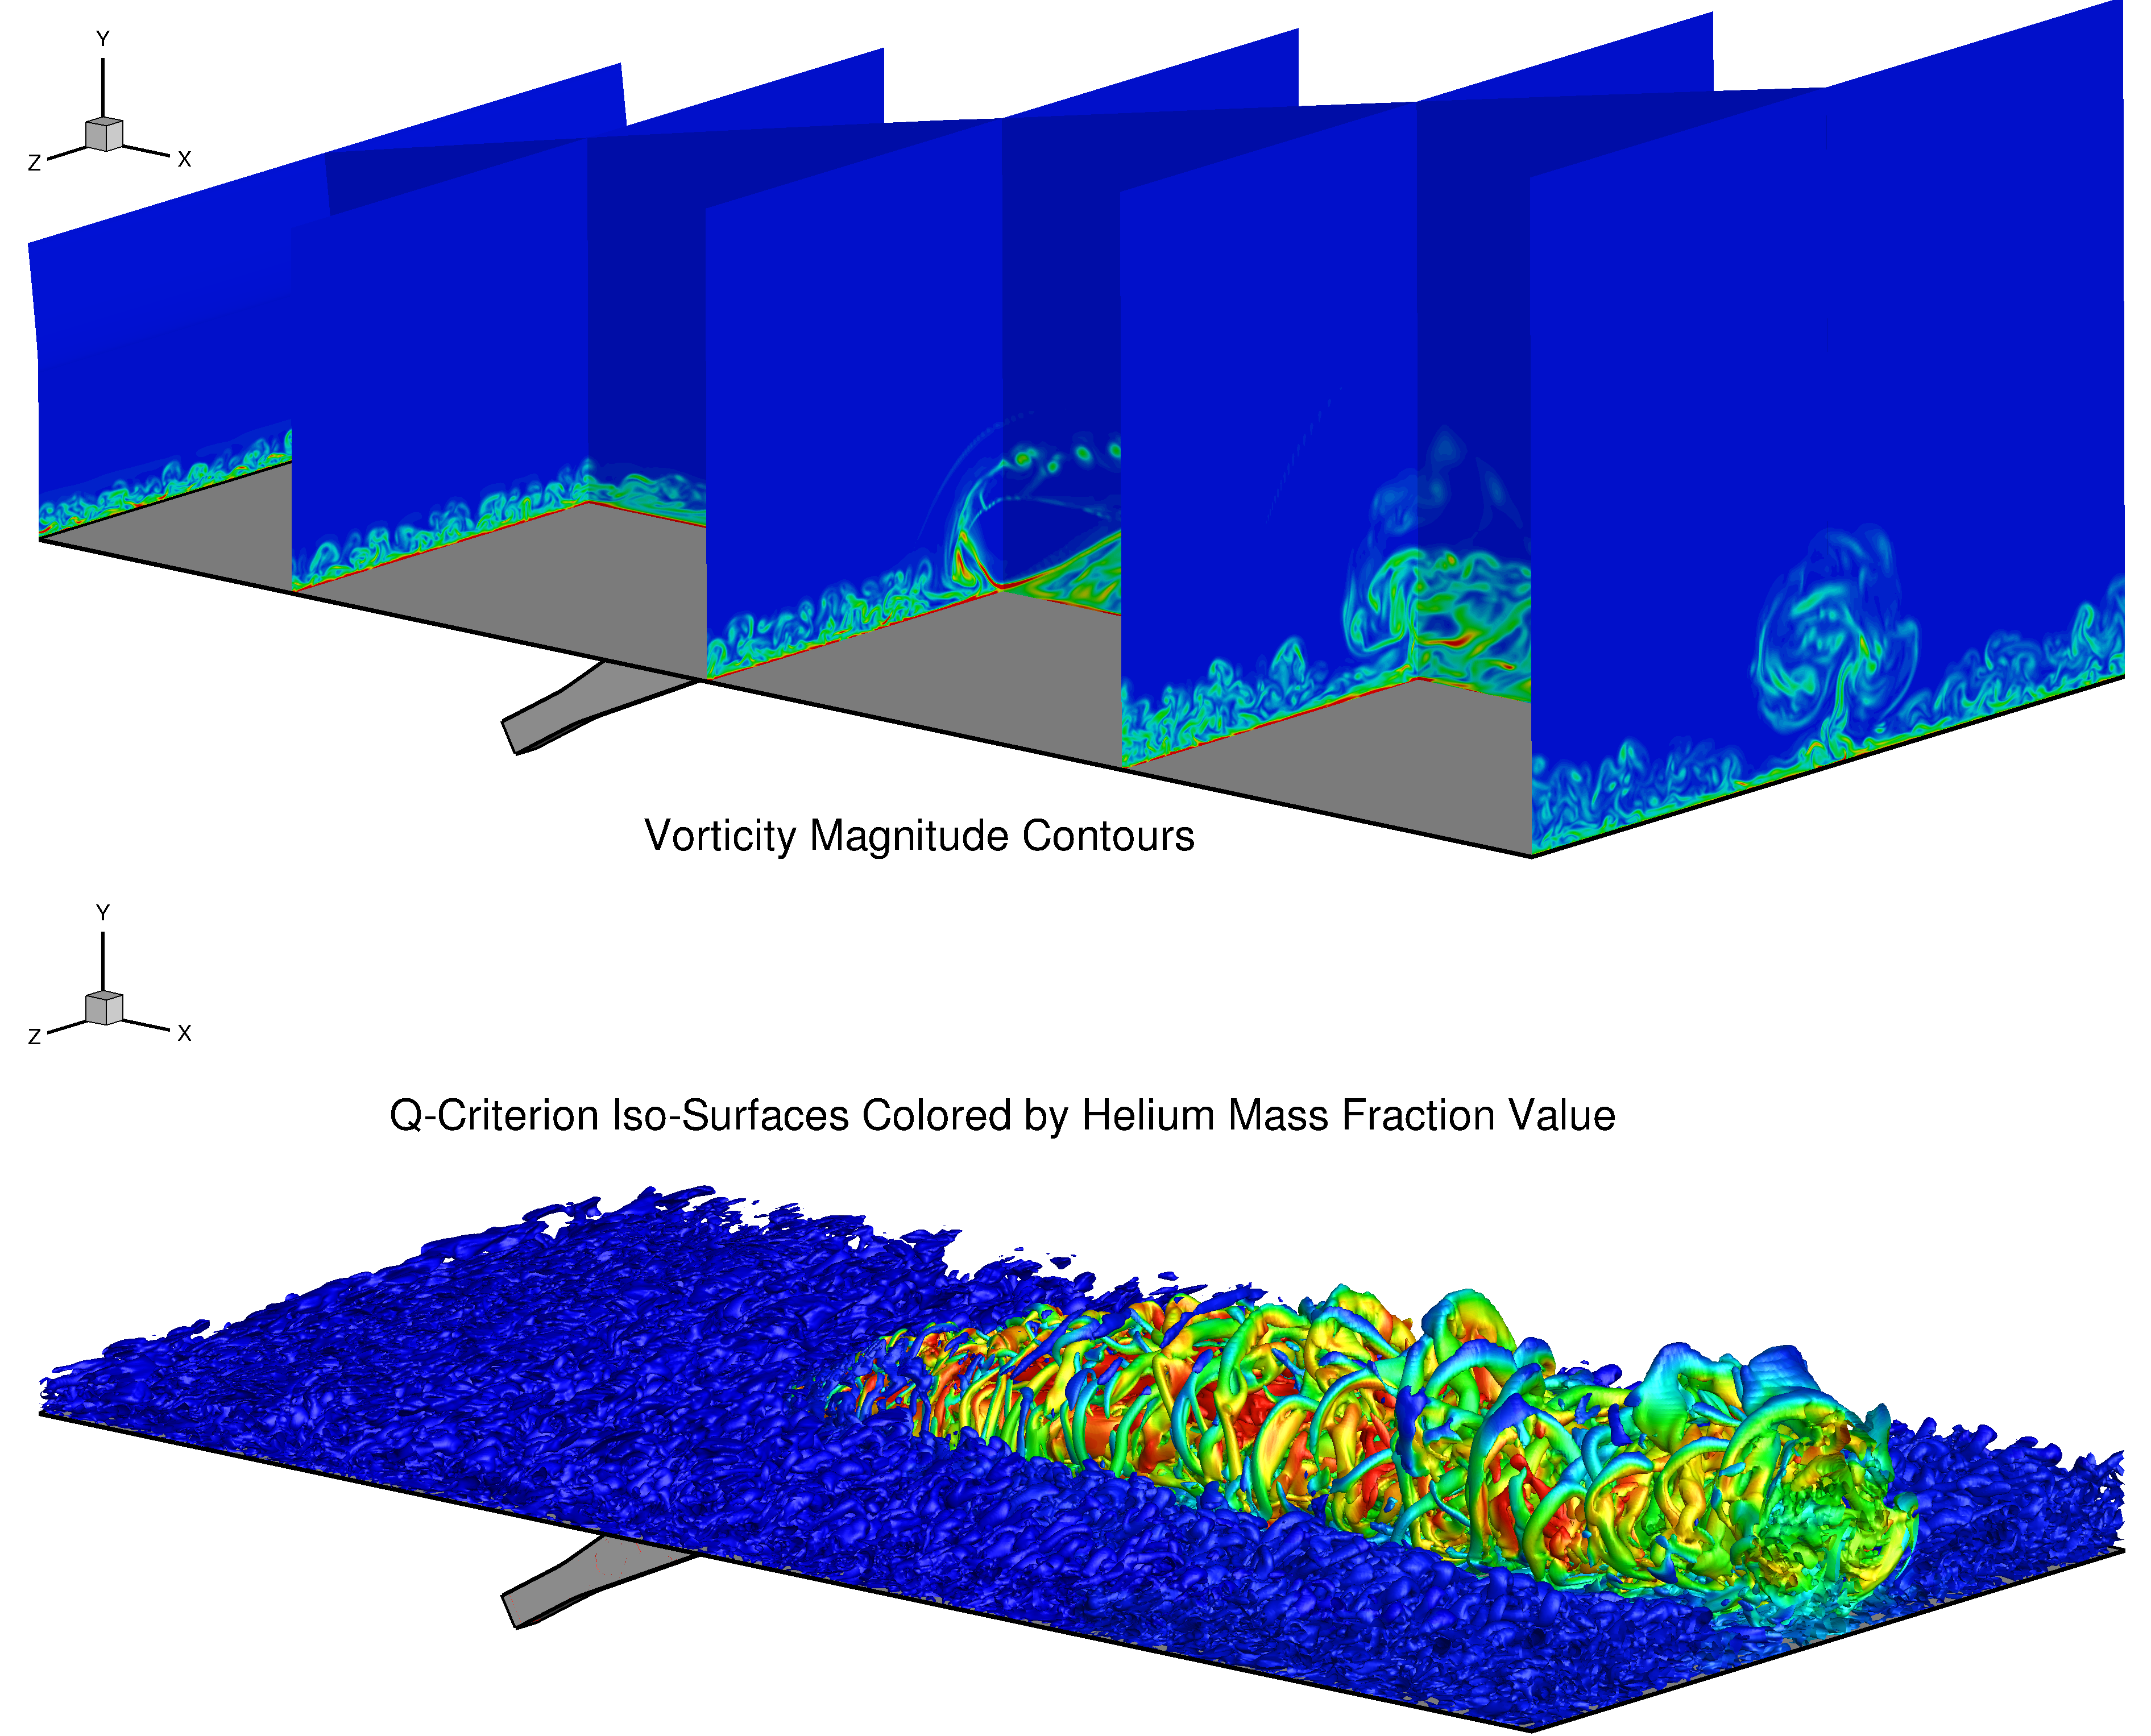
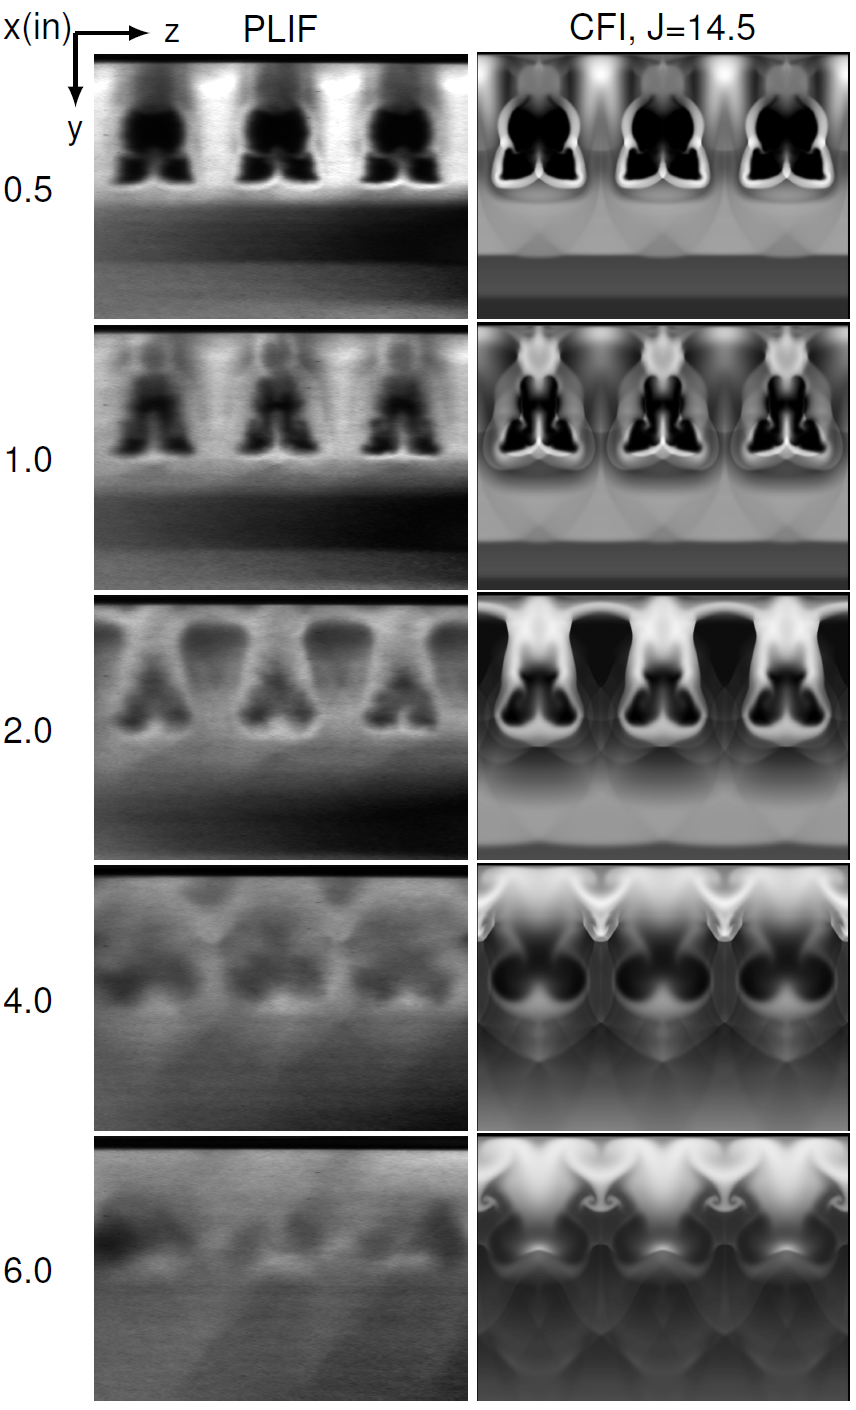
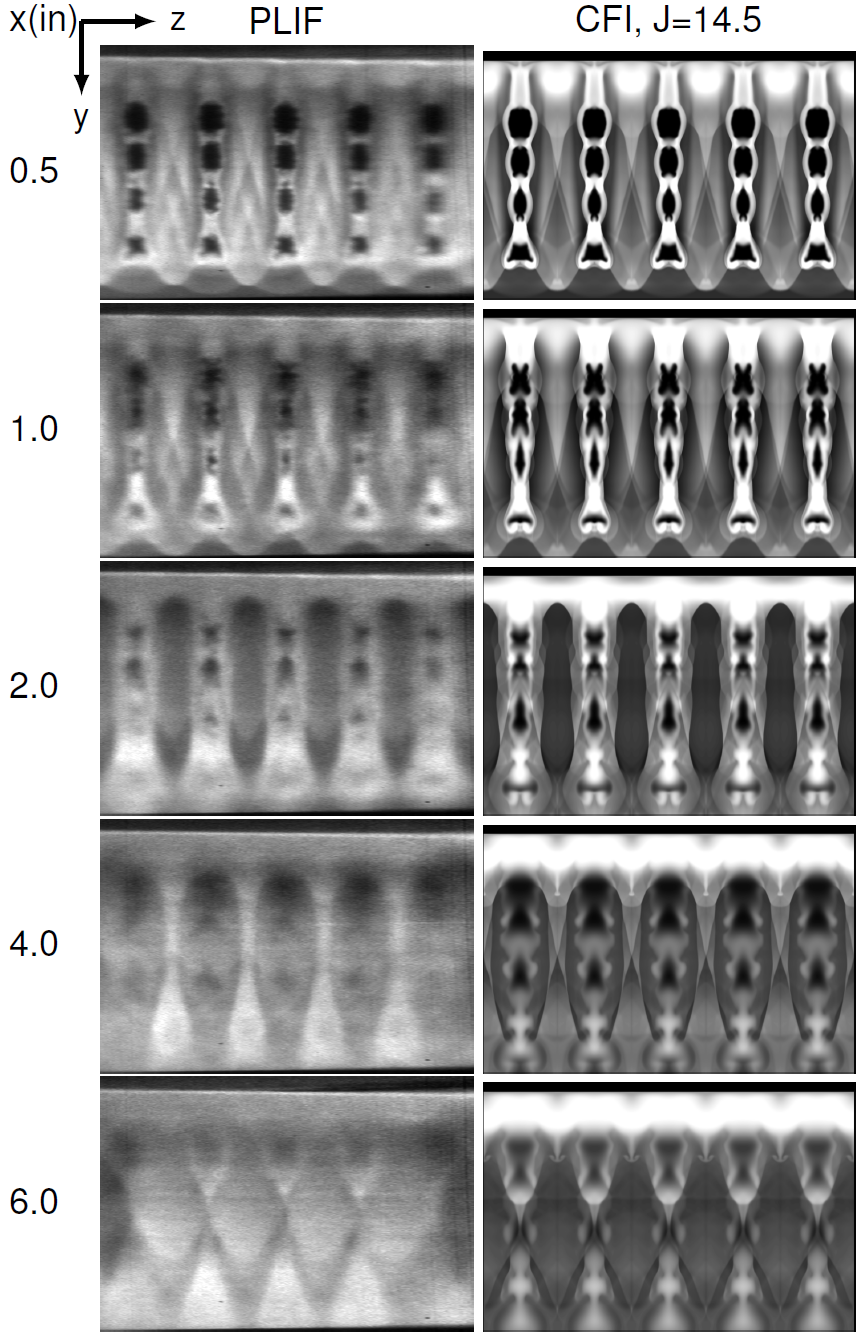
The images above show instantaneous snapshots taken from a hybrid Reynolds-Averaged/Large Eddy Simulation of flush-wall fuel injection into a Mach 6.5 air stream. The top image shows a fence plot of vorticity magnitude contours that visualize the vortical structures present in the turbulent boundary layer and fuel/air mixing region. The bottom image is an iso-surface of the Q-criterion colored by fuel mass fraction values. This image provides a visual of how the turbulent flow structures are enhancing the mixing between the fuel and air streams. Computational Fluid Imaging (CFI) comparisons of several scramjet injector configurations with time-averaged planar NO PLIF measurements made in the NASA Langley Scramjet Test Facility are provided in the links below. Further details describing the CFI comparisons with NO PLIF measurements can be found in [[Drozda et al., 2018].
CFI comparisons with NO PLIF measurements for an array of ramp injectors
CFI comparisons with NO PLIF measurements for an array of strut injectors
Laminar Flow Simulations of the HIFiRE Flight 5 Elliptical Cone
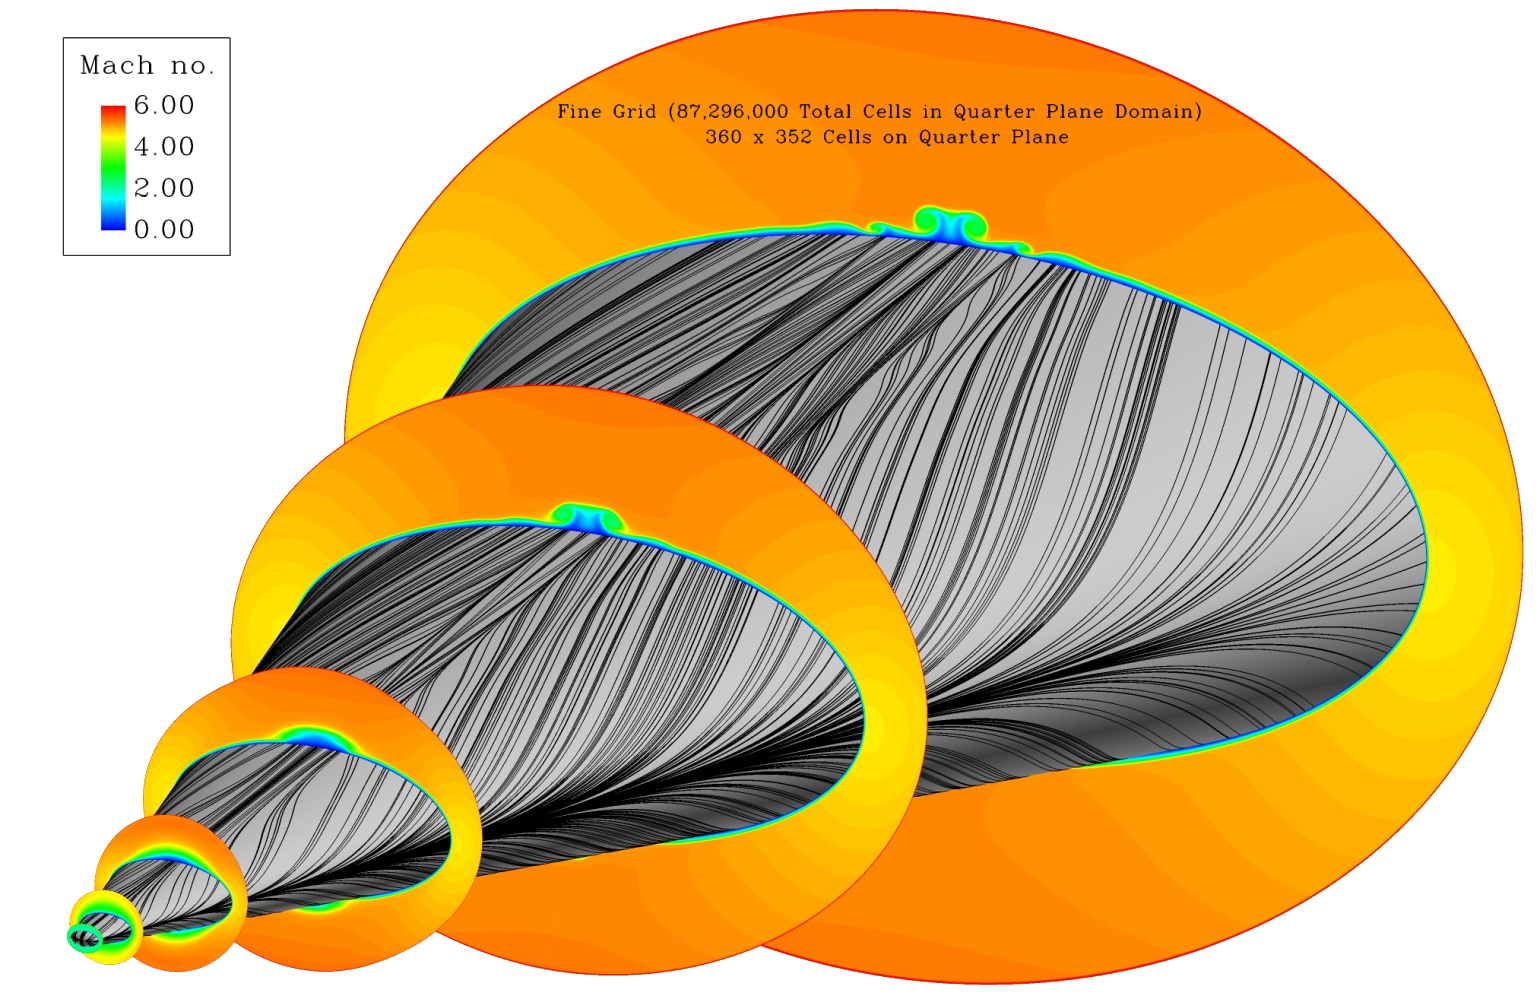
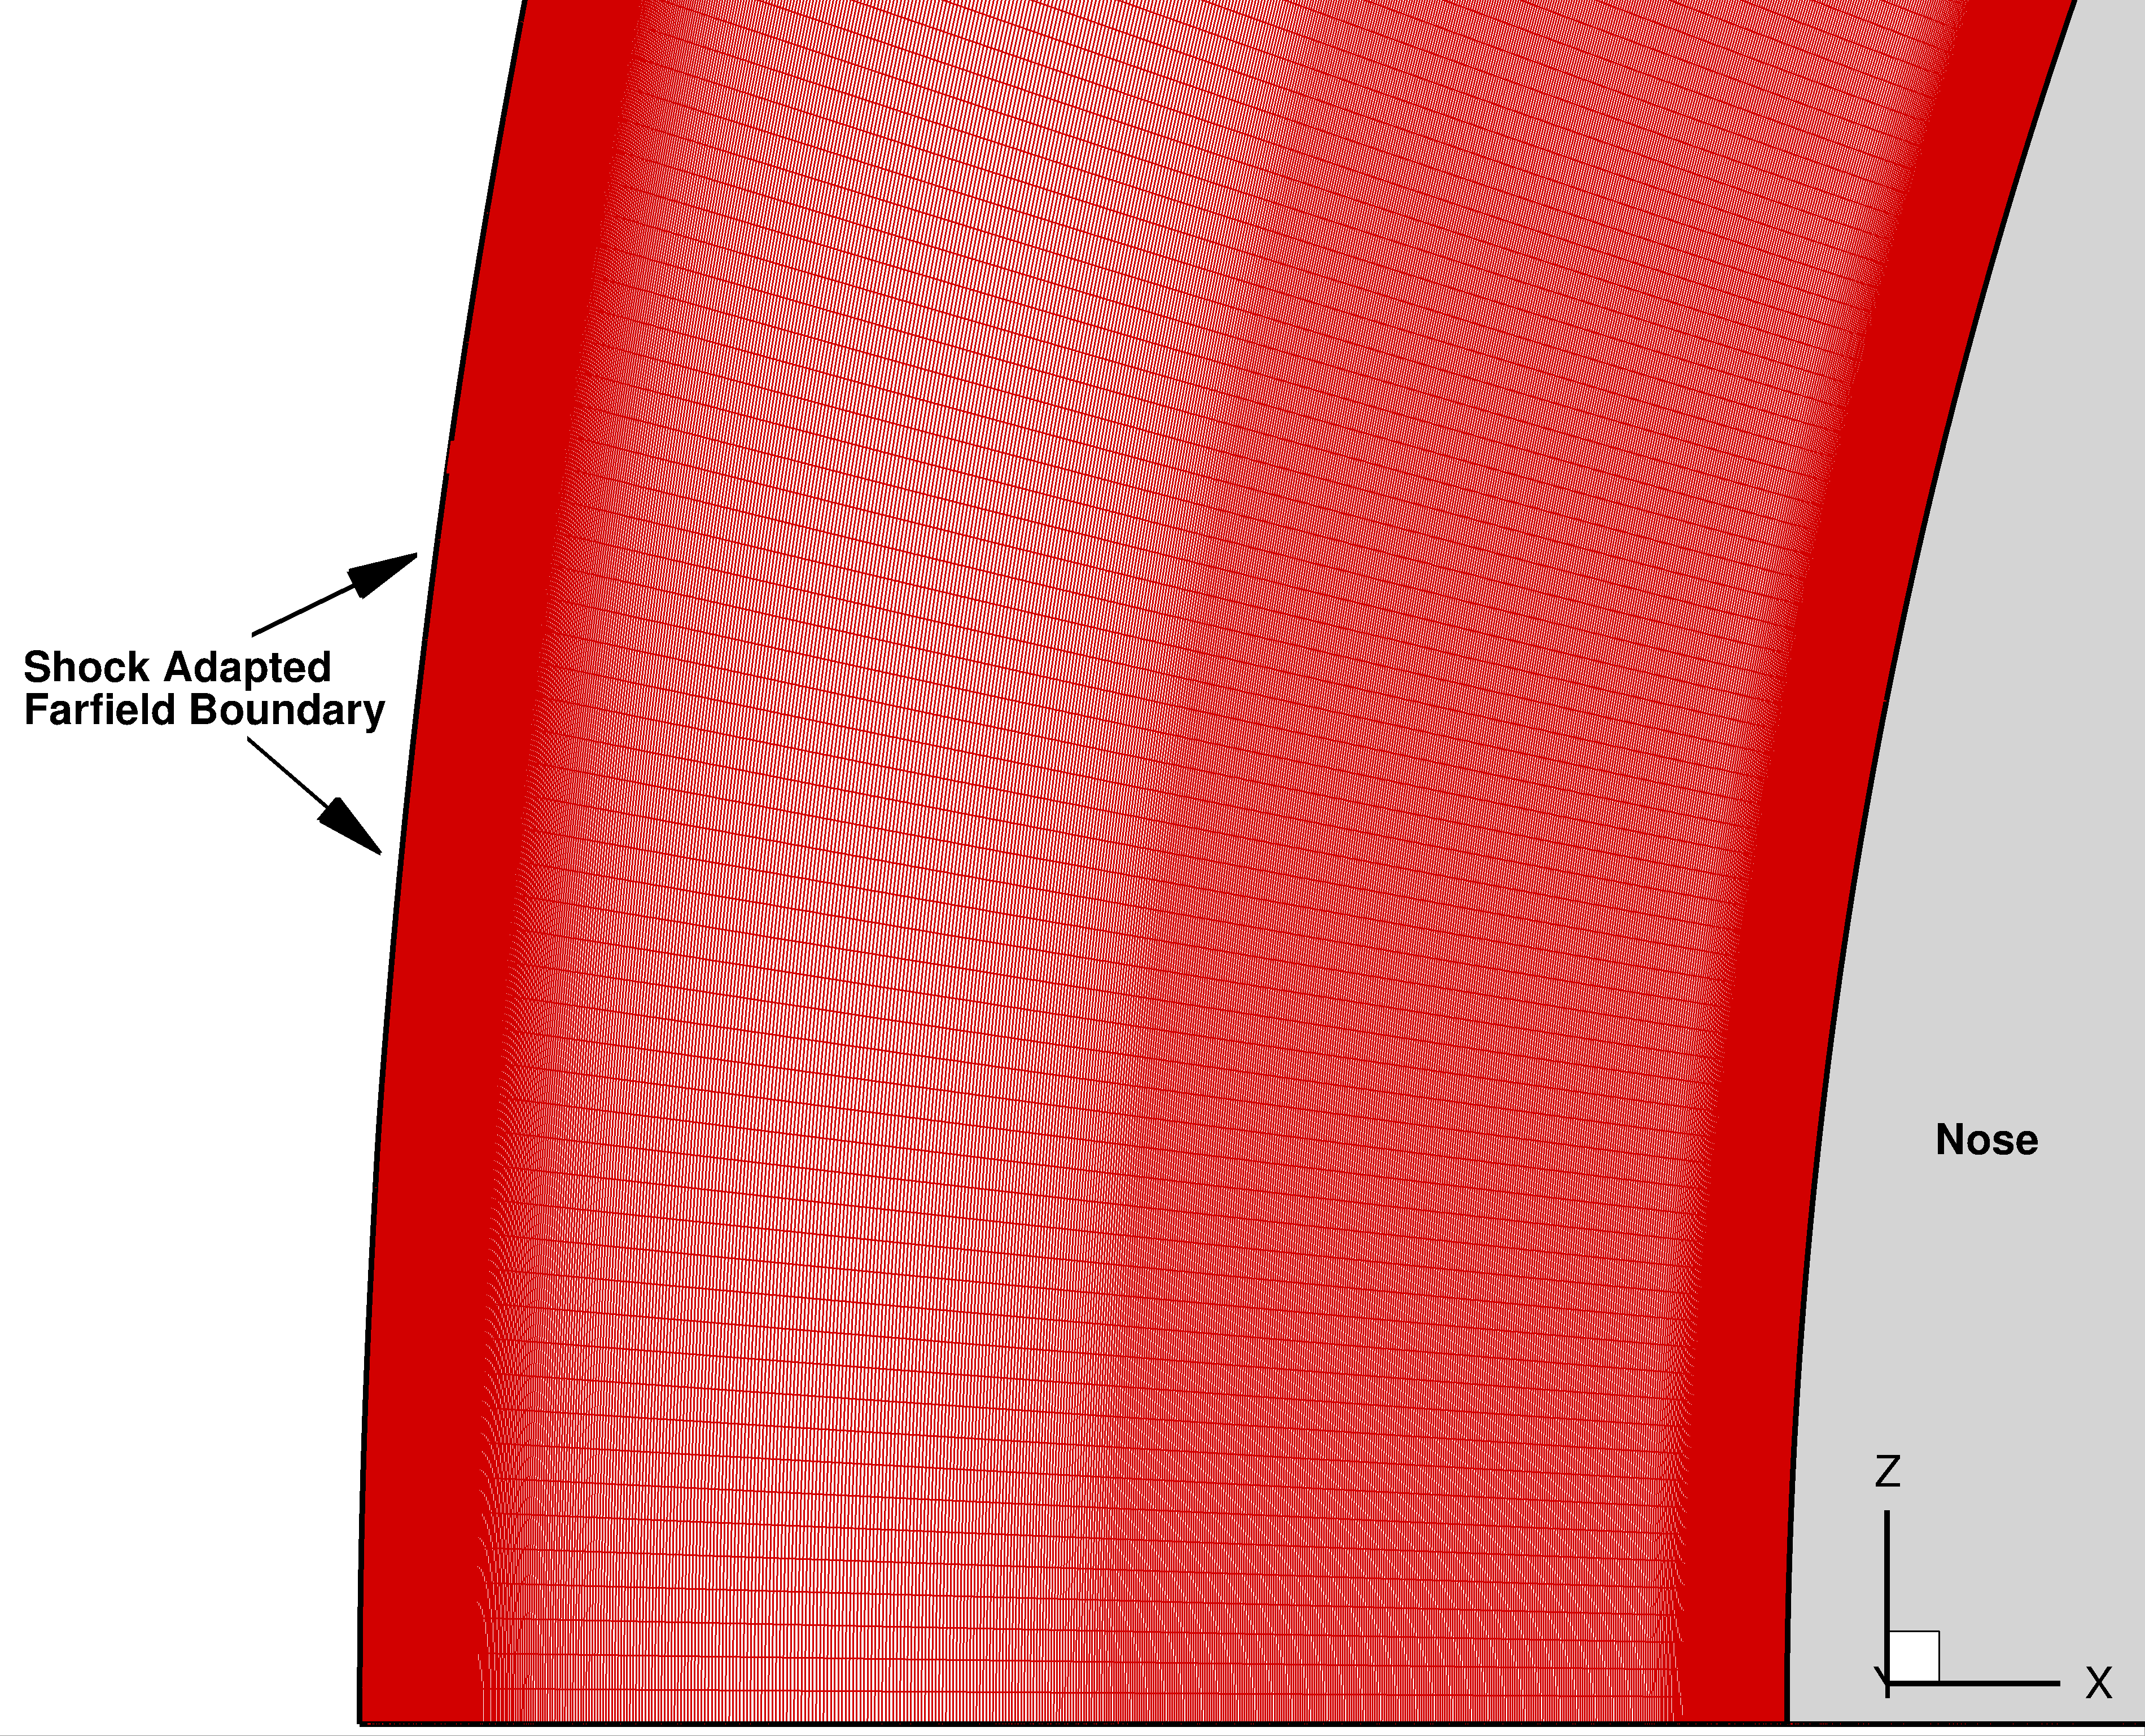
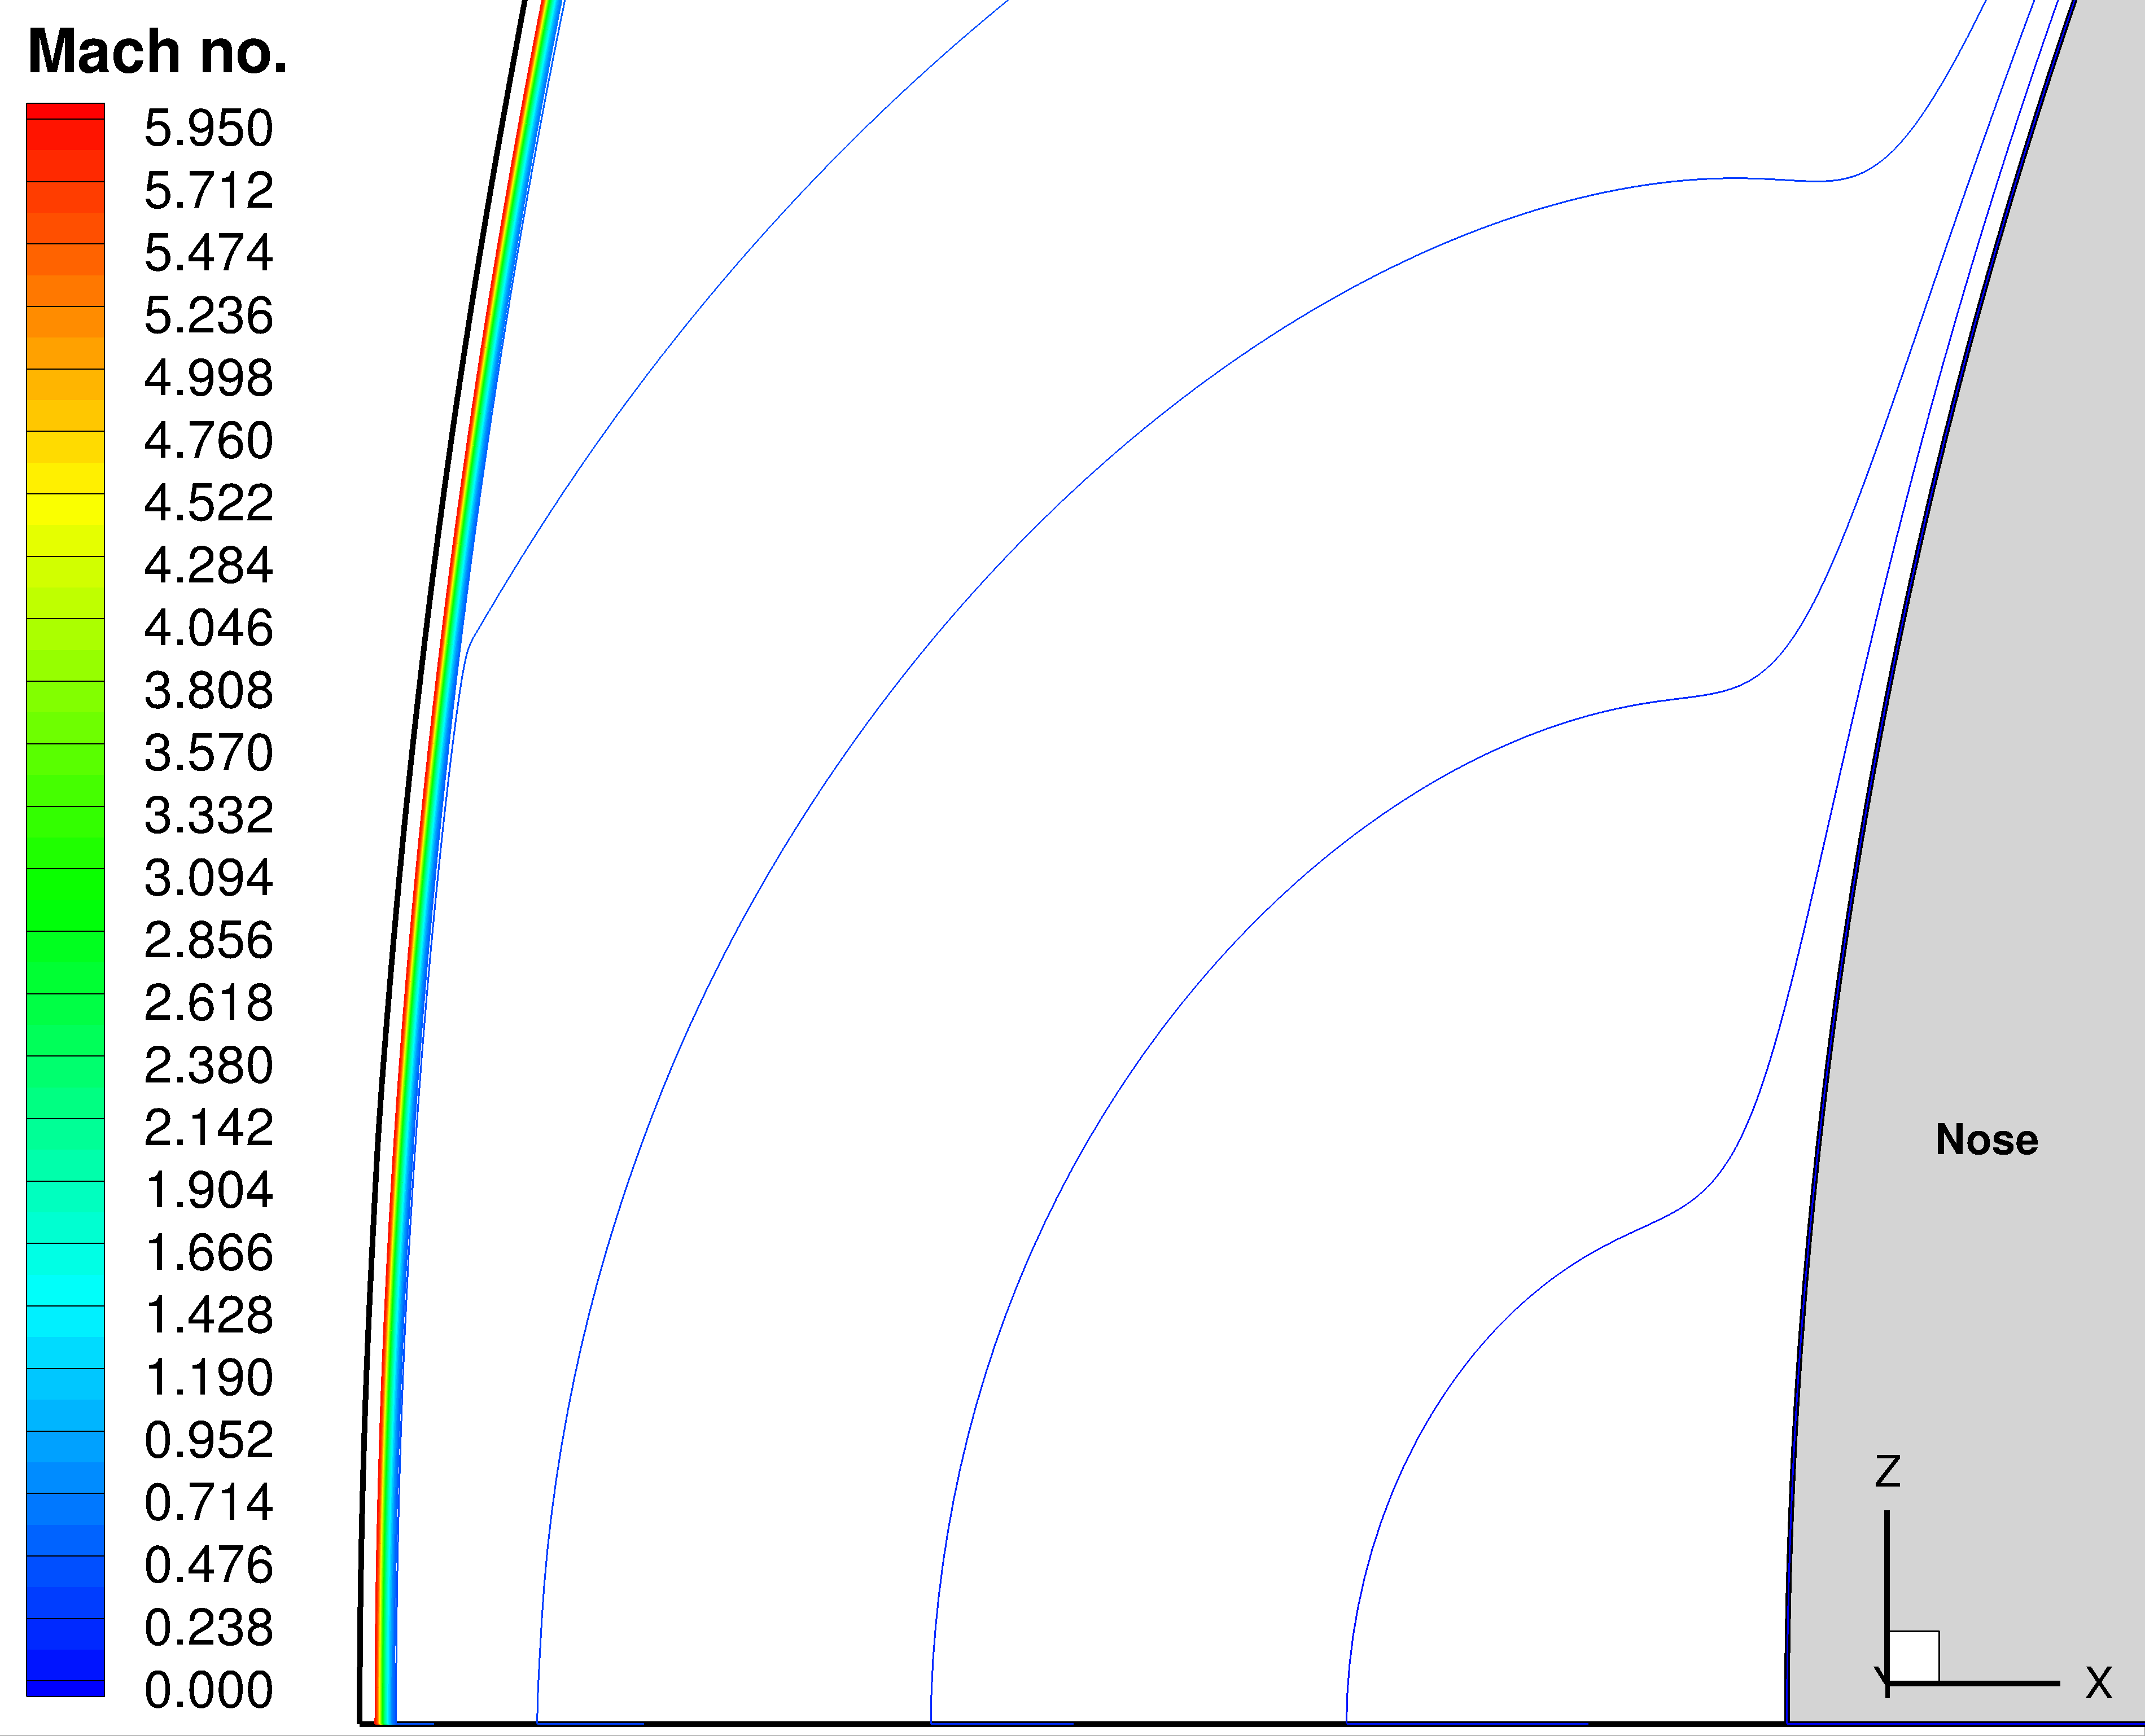
The image above displays the laminar flow Mach number contours and surface streamlines for the HIFiRE flight 5 elliptical cone designed for hypersonic transition to turbulence research. Highly resolved laminar flow solutions (also referred to as basic state solutions) are used to provide the mean state for boundary layer stability analysis via the parabolized stability equations, and any numerical noise present in these basic state solutions can pollute the stability analysis. To alleviate noise due to poor grid alignment with the bow shock that is formed around the body, the bow shock alignment/adaptation feature of VULCAN-CFD has been used. This feature aligns the farfield boundary to the shock wave and clusters the grid to the bow shock that surrounds the vehicle. Further details that describe the boundary layer transition analysis for this application can be found in [Li et al., 2012].
Zoomed in view of the adapted grid near the nose
Zoomed in view of the Mach contours near the nose
|
|
|
|
|
|
This site's most recent update took place: 05/16/2025
| Privacy Policy and Important Notices | Copyright Notice |